
Market Research: What It Is & How to Do It
To compete in today’s highly competitive markets, it’s essential to keep your finger on the pulse of what's going on in your industry.
Well-conducted market research will help you with that.
In this article, we’ll explore:
- What market research is and why it's important
- Different market research types and methods
- How to do market research
Let's dive in.
What Is Market Research?
Market research is the process of gathering and analyzing information about your business's target market. The main goal is to discover who your customers are and what they want.
Market research helps you answer questions like the following:
- What are the demographics of my target audience?
- What are their interests and buying habits?
- What do they think about my business or industry?
- What problems can I help this group of people solve?
- How can I best connect with them?
Market research analysis is more than simply tracking numbers. It goes one step further by attempting to uncover the “why” behind the numbers.
Why Should You Do Market Research?
Understanding your target audience allows you to:
- Identify business opportunities
- Attract a loyal customer base
- Find out what influences buying behavior
- Verify the success of a product
- Understand your brand perception
All of these things contribute to a healthy business plan and robust marketing strategy.
When Should You Conduct Market Research?
Market research can take up time and resources. Be strategic about when you conduct your research studies.
Here are four times when you should consider conducting market research:
- Before launching a new business or venture: Initial market research helps you uncover competing products, pricing structures, and marketing efforts of your competitors
- Before entering new markets: It’s crucial to understand your potential customers in new markets. Economic shifts, emerging trends, and cultural values differ from place to place. Market research helps you avoid costly mistakes.
- Before developing or launching new products or services: As your company grows, you’ll likely roll out new products and/or services. You’ll want to understand the market conditions before making any big moves.
- After any of the above: After launching a new business, entering new markets, or releasing new products or services, conduct follow-up research. This will help you determine what’s working and what needs work.
Besides the above situations, you should always keep an eye on trends and industry developments. Markets and customers are always changing. It’s important to stay informed.
Further reading: How to Define Your Target Audience
Types of Market Research
Before conducting market research, consider what insights you’re looking for:
- Are you trying to understand your competitors?
- Do you want to better market your products?
- Looking to address a customer pain point?
There are two main types of market research to address these questions: primary market research and secondary market research.
Primary Market Research
Primary market research brings you close to the action. You do it yourself, usually up close and personal with the subject of the research.
For example, primary research methods can include:
- Focus groups
- Interviews
- Observation-based research (like in-person observation)
These research methods allow you to collect two types of data:
- Qualitative data: Descriptive data you cannot express in numbers. Examples include people's preferences, dislikes, and emotional responses. Interviews and discussion groups typically produce qualitative data.
- Quantitative data: Number-based data, including page views and social media follows. You usually present this kind of data in charts and graphs.
Secondary Market Research
Secondary market research refers to third-party data you collect from public or private records that are not your own. Because the data is already available, it’s typically more cost-effective. And less resource-intensive.
Here are some examples of secondary sources:
- Company reports: Company-created reports about their own businesses (e.g., company websites, investor relation websites, Yahoo Finance, Google Finance)
- Industry statistics: Information and data on entire industries, as opposed to single companies (e.g., Statista, Pew, Gartner, Forrester)
- White papers: Authoritative market analysis written by third parties about a specific topic related to a given industry (e.g., trade magazines, market research companies)
- Government agency data: Government-collected data shared with the general public (e.g., Bureau of Labor Statistics, Census data, U.S. Securities and Exchange Commission)
Secondary sources provide a macro-level view of your industry, plus insights about other competitors in the market. Just make sure the data and insights are accurate and reliable by using reputable sources.
Market Research Methods
The best market research method depends on what you’re trying to understand about your market. Of course, you can combine multiple methods to get a more comprehensive view.
Here’s a breakdown of recommended methods based on your market research goal:
- Interviews
- Focus groups
- Surveys
- Observational research
- Market segmentation and demographics
- Competitive analysis
- Secondary market research data
- Focus groups
- Market segmentation and demographics
- Competitive analysis
- Interviews
- Focus groups
- Surveys
Now, let's take a closer look at seven popular market research methods.
Interviews
Interviews allow for in-depth discussions with people from your target audience. They can be free-flowing and unstructured. Or structured and detailed.
Before conducting an interview, think about what kind of information you need and develop a list of questions.
Here are examples of questions you can ask to address specific areas of business:
- Customer pain points: What are the main issues you face with X?
- Customer goals: What are you looking for in X?
- Brand awareness: Have you heard of X?
- Brand preferences: Do you prefer X over Y? Why?
- Pricing: How much would you pay for X?
- Customer interests and behavior: How do you spend your free time?
Note: While you can record interviews to help record the data, keep in mind that recording can influence people’s answers.
Competitive Analysis
Competitive analysis is the process of researching your competitors’ products, services, prices, promotions, and other activities.
By analyzing competitors, you can avoid their mistakes, replicate their success, and stay on the cutting edge of your industry.
Try a competitor analysis solution like the Market Overview from the Semrush Traffic & Market Tooklit.
After entering your competitors’ domains, you'll get a complete overview of your market (including its size, traffic, and consolidation).
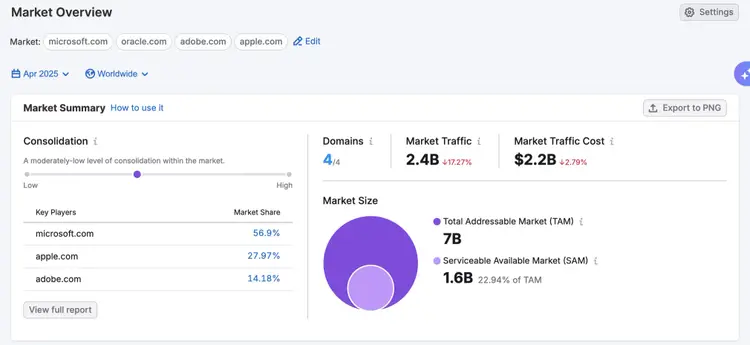
The dashboard also provides information about competitors' traffic trends among top marketing channels.
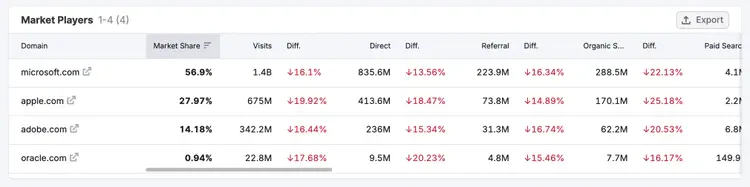
Use this data to benchmark what success will look like for your business.
Note: Learn more by reading our detailed guide to competitive analysis (with a template).
Focus Groups
Focus groups are group interviews where participants can test your product, provide feedback, answer questions, etc.
They allow you to get insights into your target audience in a way that would not be possible with other methods.
Focus groups typically consist of five to 10 people who represent your target audience. Sessions are typically recorded.
Look for the following when you review the data:
- Repeated words or phrases
- Similar reactions (confusion, frustration, delight)
- Inconsistent reactions or outlying opinions
- Quotes that capture the essence of the group’s feelings, reactions, and opinions
Collect the data in a spreadsheet so you can organize and categorize it later for deeper analysis.
Market Segmentation
Market segmentation is the process of dividing your market’s audience into groups based on shared characteristics. Common ways to segment an audience include:
- Demographic characteristics, such as age, gender, and location
- Socioeconomic factors, such as household income and employment status
- Psychographic characteristics, such as interests, desires, and preferences
Segmenting your audience helps you understand what different customer groups need—and build marketing campaigns that speak directly to them.
Use audience research tools, customer surveys, interviews, and market research to gather these insights.
For example, Semrush’s Demographics dashboard provides information about your competitors’ audiences—or nearly any audience in the market.
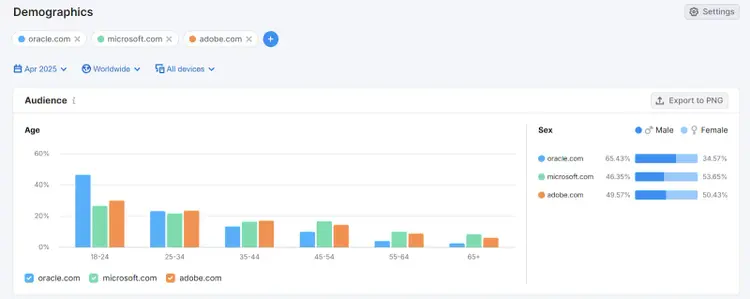
A quick look at the data can reveal important audience characteristics. In this example, people ages 18 to 24 make up the largest segment. The gender distribution is relatively balanced: Oracle has a slightly larger male audience, while Microsoft and Adobe have slightly larger female audiences.
Semrush’s Audience Overlap dashboard shows which other websites your competitors’ shared audiences visit.
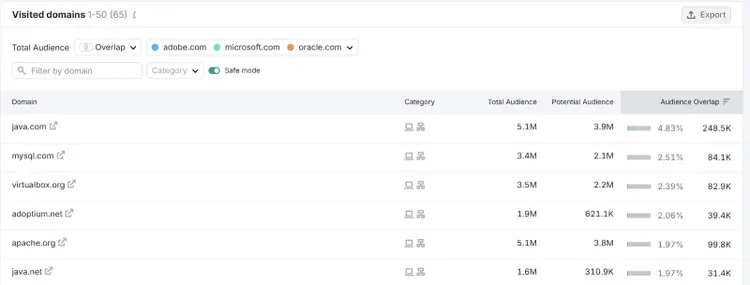
These insights can help you identify the products your audience may want and create buyer personas—profiles representing your ideal customers.
You can then target your campaigns more effectively with relevant messages, relatable language, and products that fit your customers’ needs and budgets.
Your final buyer persona profile will look something like this:
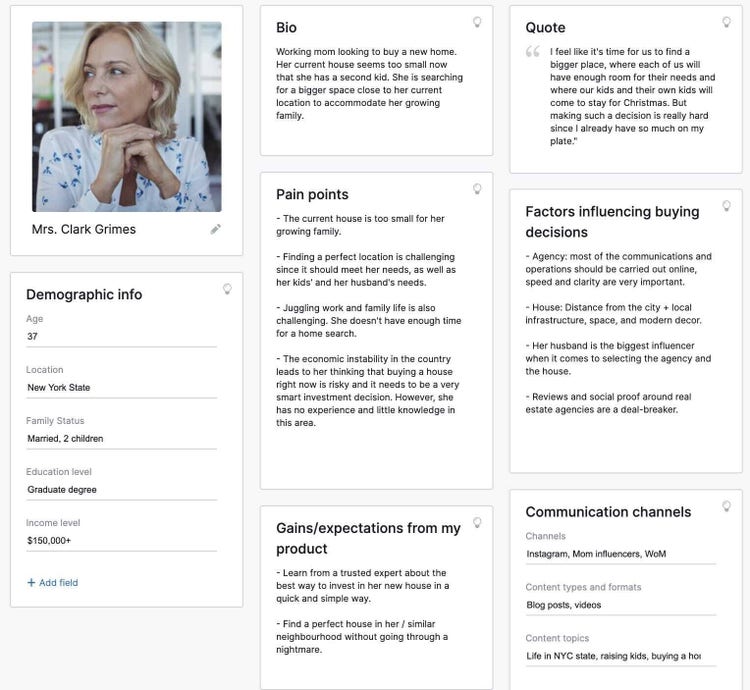
All of this helps you target your campaigns more effectively by offering messages your customers relate to, in a language they understand, about products they want and can afford.
Further reading: Market Segmentation, Website Demographics
Discover Competitive And Market Benchmarks
with Semrush Traffic & Market
Secondary Market Research Data
Market reports, white papers, and consumer rating sites provide useful data for your business. The same is true of organizations like Pew, Gartner, Ipsos, and Forrester.
For reviews and ratings, rely on sites like G2 and Trustpilot. They show insights into customer experience and satisfaction with your company and your competitors.
Here's an example of Semrush's G2 review page:
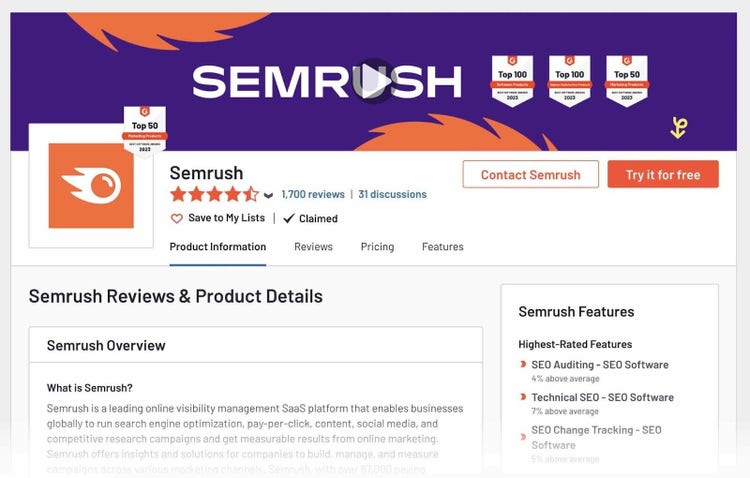
Note: Keep in mind that customers often write reviews when they are extremely satisifed or extremely dissatisfied with a product, so this data may skew in either direction.
Observation-Based Research
Observation-based research involves watching people from your target audience interact with products, services, marketing assets, etc.
The way they react, ask questions, hit roadblocks, and respond in other ways provides useful information about how to improve.
For example, you might invite participants to your office to watch them:
- Navigate through your website
- Purchase a product through your online store
- Engage with a physical product
You may notice they get lost, enjoy something particular, or get frustrated at a certain point. This data provides insights for improvements.
Surveys
Surveys allow you to connect with your audience and receive direct feedback. Conduct online surveys to reach a large number of participants and get answers quickly.
Services like SurveyMonkey and Google Forms provide survey templates, distribution tools, and data organization and display options. Some social media platforms also allow you to survey your audience.
Here's an example of a simple poll conducted by Semrush on LinkedIn:
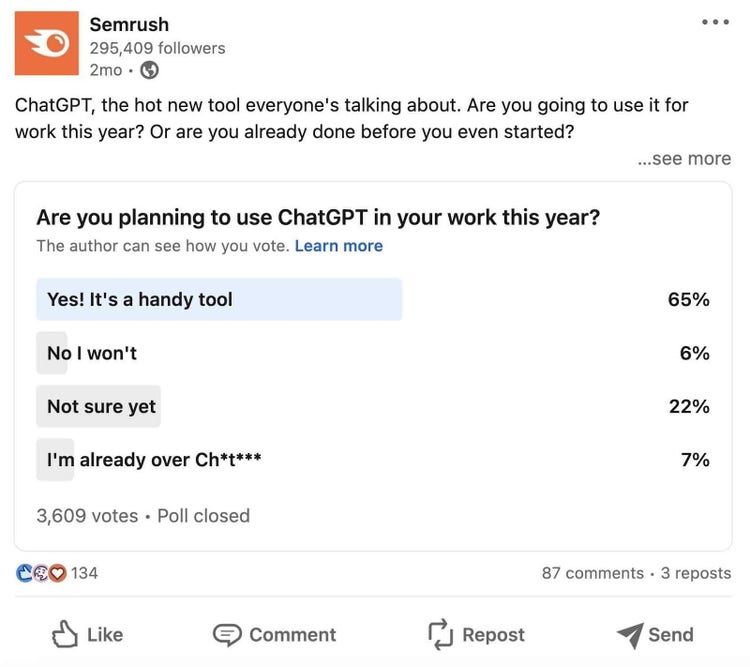
Surveys allow you to collect both quantitative and qualitative data. Provide a variety of question types—multiple choice, “yes or no,” short answer, and scales—to engage your audience and provide a wide variety of useful data points.
How to Do Market Research (Step by Step)
Now it’s time to make a market research plan for your business.
Here’s how to conduct market research in five steps:
- Define the Focus of Your Research
- Develop a Marketing Research Plan
- Collect Data
- Analyze Data and Generate Insights
- Present Your Findings and Continue Testing
To walk you through the process, we’ll follow a fictional footwear company seeking to break into the running shoe market.
Step 1: Define the Focus of Your Research
Before you begin collecting data, narrow the focus of your research. This allows you to choose the right methods and tools.
You may choose to focus on one of the following:
- A specific question you need to answer to create more effective marketing campaigns
- Market opportunities you want to explore further
- Specific topics your target audience seems interested in
Use your initial observations or questions to determine what issue or topic you want to focus on.
Then do some general research to get an idea of your audience's thoughts, preferences, and pain points.
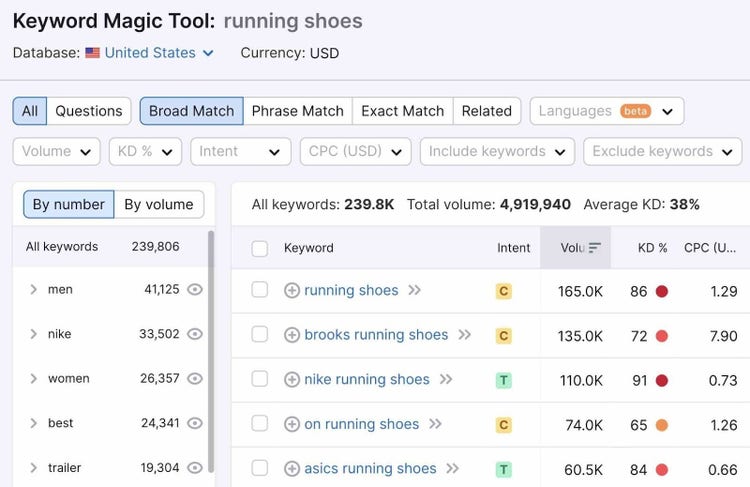
This can be as simple as conducting keyword research with a tool like Semrush's Keyword Magic Tool.
Type in the seed keyword (any general keyword related to your niche or product), choose the target country, and click “Search.”
Our footwear company launching a new shoe line might choose “running shoes.”
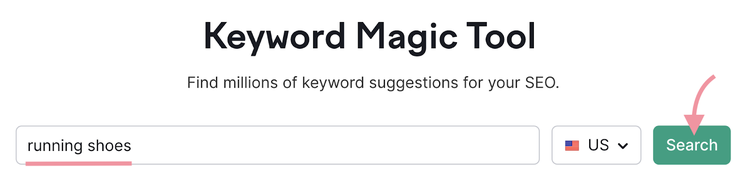
You'll get a list of keyword suggestions:
Then, switch the search criteria from “All” keywords to “Questions.”
This will help us explore the most common questions people have about running shoes.
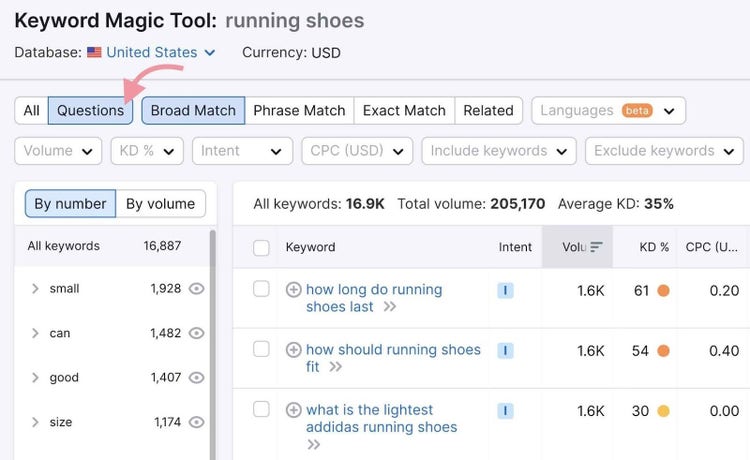
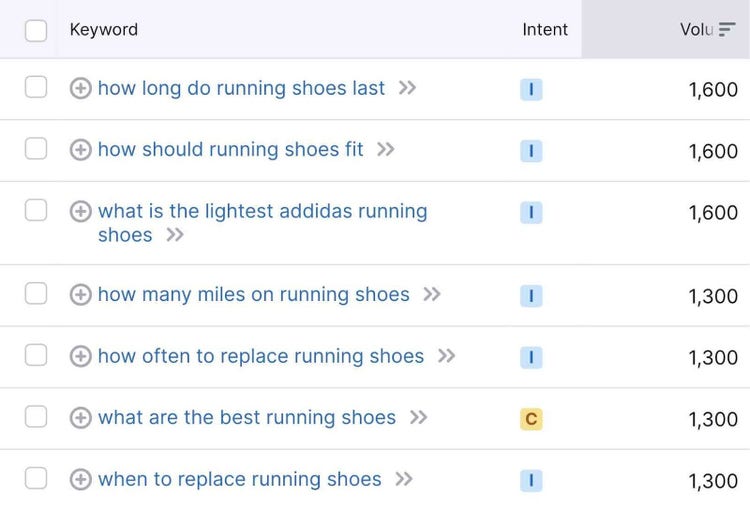
The top searches revealed some consistent themes:
- How long do running shoes last?
- When should you replace your running shoes?
- What are the best running shoes?
We can narrow down the results to only see keywords with commercial search intent. These are keywords people use when researching a product before making a purchase.
To do so, select “Commercial” in the “Intent” filter at the top.
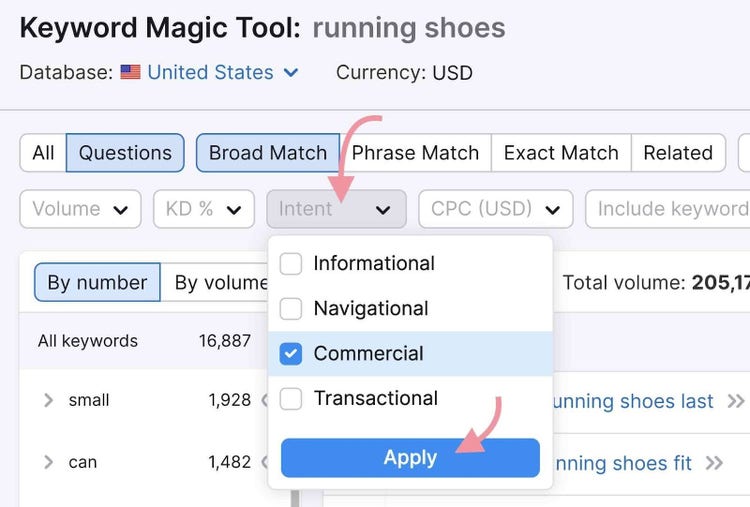
This initial search provides some ideas about where to focus our research.
For the sake of this example, let’s explore what running shoes consumers think are the best and why.
Get Keyword Suggestions
with the Keyword Magic Tool, the Biggest Keyword Database on the Market
Step 2: Develop a Market Research Plan
After you determine your research goals, develop a plan to get more data.
Start by answering some basic questions about methods you could use.
Primary source methods:
- Will you interview key individuals?
- Will you hold a focus group?
- Could you survey people about their experiences?
Secondary source methods:
- What third-party research companies have researched your market?
- Could you access customer reviews?
- Can you look at other companies' marketing efforts?
Let’s return to our example shoe company. If we want to understand more about what shoes runners like best and why, we could pick three methods:
- Review studies conducted by third-party market researchers about product quality (manufacturing, features, life span, etc.)
- Interview runners about their experiences with various shoes
- Hold focus groups to understand how people think, feel, and talk about their favorite brands
Before beginning the hands-on research, get a bird’s-eye view of the market. This will help you pinpoint industry leaders. And see what their strategies and growth prospects look like. The
Traffic & Market Toolkit can help you do this. Let’s continue with our running shoe example.
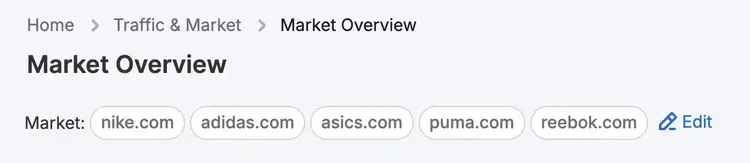
Begin by plugging Nike and key competitor domains into the Market Overview dashboard.
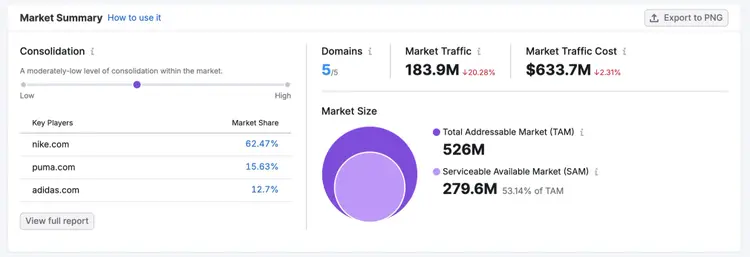
Start with the Market Summary section of the dashboard. Here you’ll find data related to:
- Market consolidation
- Market share
- Market traffic
- Market Traffic Cost
- Market Size (TAM & SAM)
Scroll down to discover the Growth Quadrant. This helps you understand how competitors are growing over time in relation to one another.
The Growth Quadrant contains four sections:
- Game Changers: Emerging websites with high growth potential
- Leaders: Big, well-known companies whose website traffic is growing
- Niche Players: Companies with a smaller presence
- Established Players: Stable, popular websites
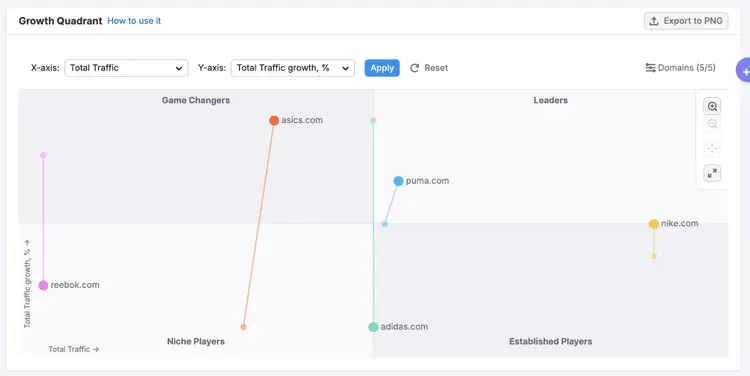
Overall, these insights help us determine what research methods we want to use and what questions we’d like to ask our target audience.
Once you’ve decided which direction to go in, come up with a timeline, delegate responsibilities, and execute your research.
Step 3: Collect Data
How you collect data will depend on the type of research method you choose.
For qualitative research, like focus groups or interviews, write out answers and compare notes later. With surveys, you might produce reports.
Tools like Google Forms and Survey Monkey offer reports that organize your data and even include illustrations where applicable.
For quantitative research, collect raw data using a simple spreadsheet or more advanced data storage software. Tools like Google Looker Studio (formerly Google Data Studio) and Tableau allow you to organize and depict data as graphs or charts.
For our footwear company example, we might collect qualitative data through our focus groups and interviews. For quantitative data, we can use The Traffic & Market Toolkit.
For example, Top Pages in the Traffic & Market Toolkit provides traffic numbers for competitors’ websites.
First, select your target location, timeframe, and device type. Then, enter a competitor’s domain.
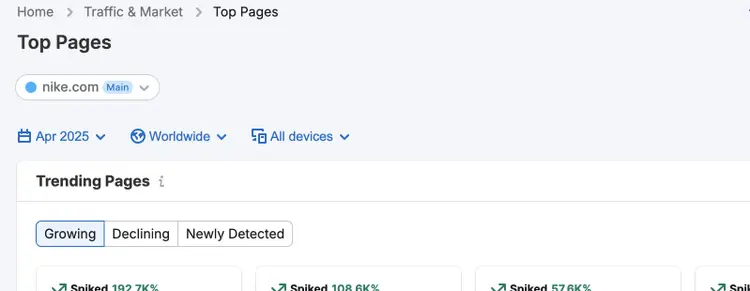
You'll get useful insights into your competitors’ traffic—including visits, traffic sources, etc.
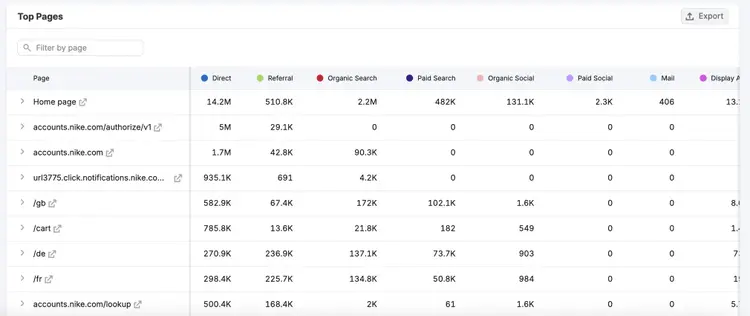
It allows us to see which pages have shown significant growth in traffic in the last 12 months.
Taking products among the top pages, we could study customer responses in our focus groups to this launch or compare the traffic numbers or sources with new releases coming from competitors.
Step 4: Analyze Data and Generate Insights
Analyzing data helps you discover answers to your initial research question(s) and turn those answers into strategies. This process begins by organizing the data.
With quantitative data, add everything up and enter it into a central location. Like a spreadsheet.
Organize ratings, rankings, “yes and no” answers, selections of multiple choice questions, and any other data. Once it’s organized, crunch the numbers to look for averages, ranges, or other important statistics.
For qualitative data, review all of the collected data and sort it into categories.For example:
- Concerns
- Questions
- Frustrations
- Strengths
- Weaknesses
- Recommendations
Organizing this data will help clarify themes.
Once you organize your data, review your initial research goals.
Here are some guiding questions:
- Does the data illuminate any trends?
- Can I think of any explanations for these trends?
- What’s surprising or interesting about the data?
- Does the collected data help answer my original questions?
- Does it lead to any other interesting questions?
As you notice trends or themes, present them visually. Tools like Miro and Mural can help you brainstorm, discover connections, and invite different people to the table to help interpret the data.
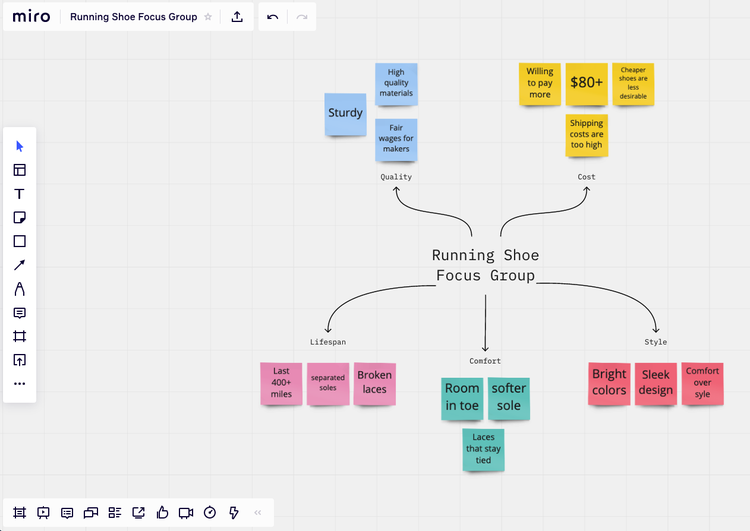
To continue with our footwear company example, let’s pretend we discovered these five insights based on the data:
- Customers like durable running shoes; their favorite shoes last a long time
- Customers are willing to pay more for quality running shoes
- Customers are less likely to be loyal to one brand; quality matters over brand
- Customers respond best to ads that depict professional runners
- Customers like flashy designs and colors on their running shoes
Highlight data that supports your argument or solves the problems you’re researching.
Don’t worry if you discover negative results or trends. This gives you a chance to change direction and drop projects or strategies that aren't working. Which can save you time and money.
Step 5: Present Your Findings and Continue Testing
Now that you’ve done the heavy lifting, it’s time to put your findings to good use.
Typically, this involves presenting your research to stakeholders and discussing improvements to your business or marketing plan.
When presenting data, it helps to show:
- How the research produced the data
- How the data led to your insights
- How your insights led to actionable suggestions
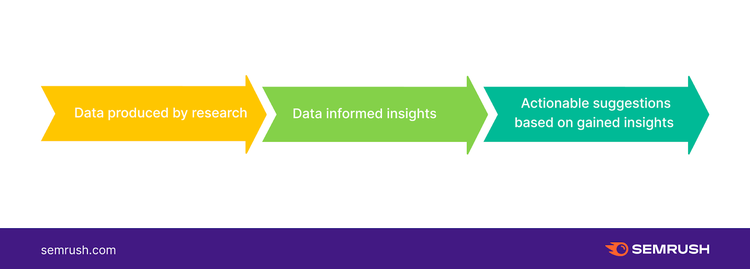
Let’s return to our running shoe company. If we wanted to present information about pricing to our stakeholders, we might structure it like this:
- We looked at which shoes avid runners prefer and why. The top shoes tend to be more expensive than less popular shoes. We asked about this in focus groups and interviews.
- Participants told us they’re willing to invest more money into a good pair of shoes. High quality matters more than lower prices. Along with this, runners who pay more expect greater durability.
- Based on this data, our business might benefit from using quality materials and manufacturing processes instead of cutting costs with cheap materials and labor. We could improve our marketing strategy by highlighting the high-quality materials and care we put into manufacturing each pair.
Once you've made adjustments to your business or marketing plan based on the data, continue your research to see if your strategies are successful.
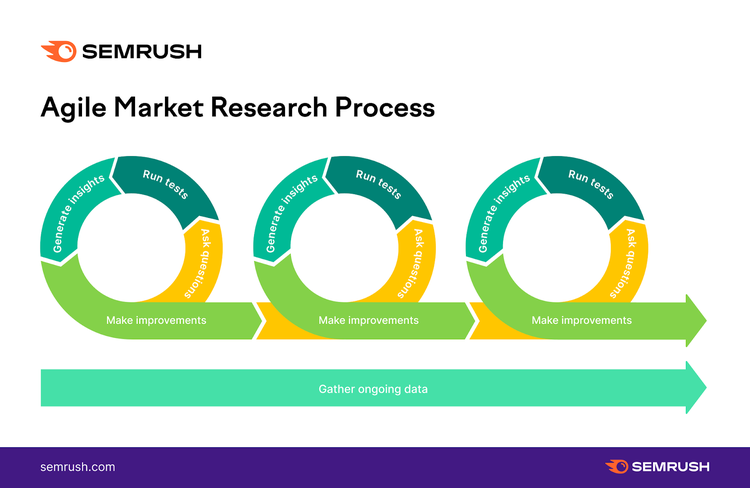
A great way to follow up on the moves you’ve made based on your in-depth market research studies is agile market research.
The “agile” part means gathering data quickly and being able to iterate the process at any time.
While it won’t replace in-depth market research, agile market research allows you to test hypotheses, receive feedback, and make swift changes.
Let’s say we conducted a large-scale study on running shoes and launched our new product. Here’s an example of what the agile market research process might look like after that:
- Ask questions: Are the new shoes we developed comfortable?
- Review customer feedback for trends: E.g., many customers said the shoes were too tight on their toes.
- Generate insights: The design of the toe in our shoes needs improvement
- Make improvements: Adjust the shape of the shoes in the toe and release new model
- Ask questions: How do your toes feel in our new shoes?
Complete the agile market research process over and over again for continuous improvement.
Before You Start Your Research
Though market research is a big undertaking, it’s necessary for survival in a competitive marketplace.
A good place to start is the Semrush Traffic & Market toolkit. The tools it contains provide you with quantitative data that will give you instant insights into your specific market and competitors.
This way, you can make informed decisions about your further data collection methods (e.g., focus groups, surveys, etc.).
You may also try the so-called SWOT analysis—a technique that helps you assess your business's strengths, weaknesses, opportunities, and threats. Read our guide to SWOT analysis that also includes a free template.
Keep an eye out, stay curious, and good luck out there!
Get Instant Insights Into Your Market
with Semrush Traffic & Market

Natalia is a data-driven marketer focusing on market research and strategy development. Having a solid experience in digital marketing, Natalia has a passion in SEO, content marketing and multilingual website creation and optimization.

Tells Google to show you more from Semrush in AI, Search, and Discover.