
Competitive matrix: what it is + how to make one (with templates)
What is a competitive matrix?
A competitive matrix is a tool that helps you visually compare your company against competitors. To see how you stack up.
It typically features a grid or table that lists your brand and key competitors on one axis. And important market factors on the other.
There are many types of competitive matrices that show data in different ways.
For example, this is the Growth Quadrant from Semrush. It’s a competitor matrix you can generate using the Market Overview dashboard (part of the Traffic & Market Toolkit).
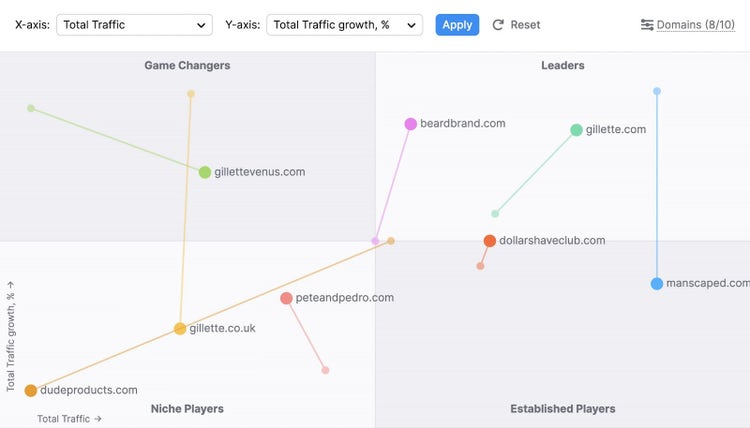
This quadrant-based matrix helps you visualize your industry’s competitive landscape. And divides competitors into four categories:
- Game Changers
- Leaders
- Niche Players
- Established Players
We’ll explain what these categories mean later. And show you how to build this matrix using your competitors’ data.
First, let’s explore the benefits of using a competitive matrix.
Tip
Get your free competitive matrix templates and sign up for a free Semrush account to follow along with the steps in this guide. Credit card is not required.
Why is using a competitive matrix important?
A competitor analysis matrix provides competitive insights that help you gain an advantage in the market.
The matrix’s main purpose is to show where your company stands compared to your competitors. To be more aware of your (and your competitors’) strengths and weaknesses.
This can then be used to:
- Strategically position your brand: By seeing how your offerings stack up against competitors, you can find better ways to position your products or services. And highlight what makes you different and fill in any gaps in the market.
- Make informed decisions: With a clear view of the competitive landscape, you can make data-driven decisions about product development, marketing, and resource allocation
- Predict competitor moves: Understanding your competitors' strengths and weaknesses can help you anticipate their next moves. And stay ahead of them.
In short, a well-researched competitive analysis matrix provides you insights to confidently navigate fierce competition. Even in a perfectly competitive market—where most businesses sell identical products.
5 Competitor matrix types with examples and templates
There are various types of competitive matrices, each for different use cases. You can choose one or more depending on your analysis goals.
Let’s take a look at some of the most popular types.
1. Competitive comparison grid
A competitor comparison grid (also called a competitive positioning matrix) is a framework that visualizes how customers perceive your company relative to your competitors.
It considers factors like price, quality, service, and innovation to help you understand your market position.
Typically, it’s drawn using two axes that each represents a crucial success factor.
Let's look at the G2 Grid for competitive intelligence tools as an example.
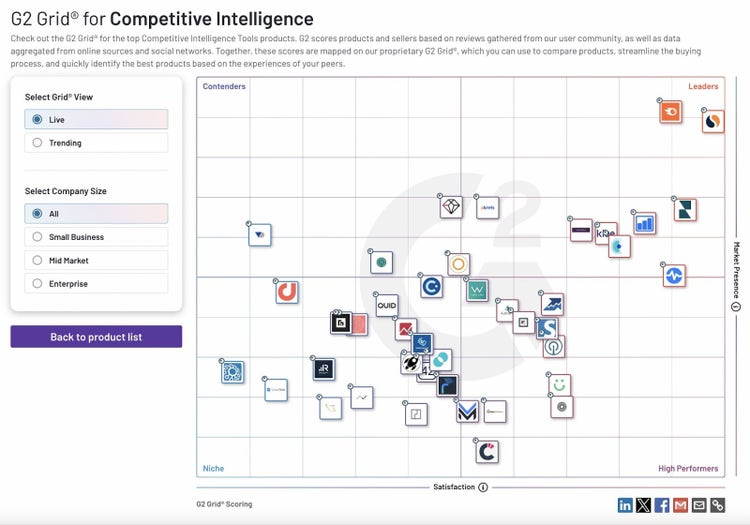
Image Source: G2
It has “Market Presence” on the y-axis—which is calculated using G2’s scoring methodology that draws from a number of sources. And “Satisfaction” on the x-axis is based on user reviews.
Based on these scores, companies are divided into four quadrants:
- Leaders: High user satisfaction and high market presence
- Contenders: High user satisfaction and low market presence
- High Performers: Low user satisfaction and high market presence
- Niche: Low user satisfaction and low market presence
You can visualize the digital competitive landscape for your industry similarly with Semrush’s Growth Quadrant in the Market Overview dashboard (part of the Traffic & Market Toolkit).
Once in the Market Overview dashboard, enter the domains you want to research, and choose a timeframe and geographic region.

Scroll to the “Growth Quadrant” widget.
You’ll see your website’s positioning compared to competing sites. Like this:
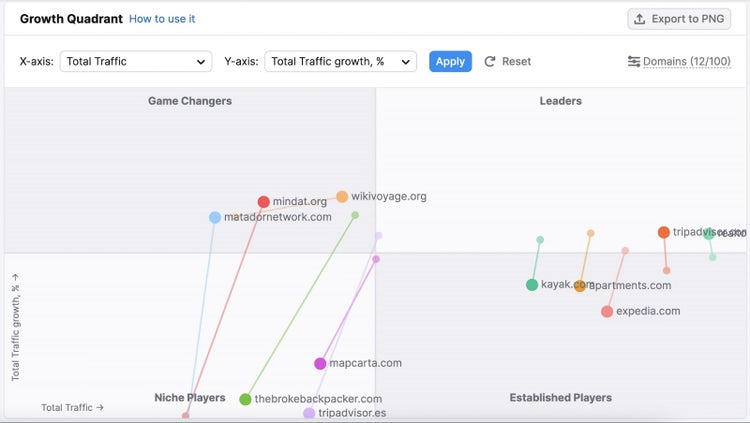
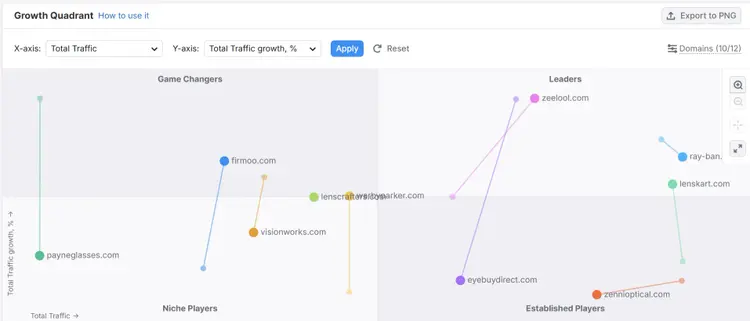
Using the “Total Traffic” and “Total Traffic Growth, %” metrics, the websites are categorized as:
- Leaders: High-traffic sites with high growth rates
- Established Players: High-traffic sites with low growth rates
- Game Changers: Low-traffic sites with high growth rates
- Niche Players: Low-traffic sites with low growth rates
You can choose different metrics for comparison as well.
Just click the drop-down menu next to “X-axis” and “Y-axis,” make your selections, and hit “Apply.”
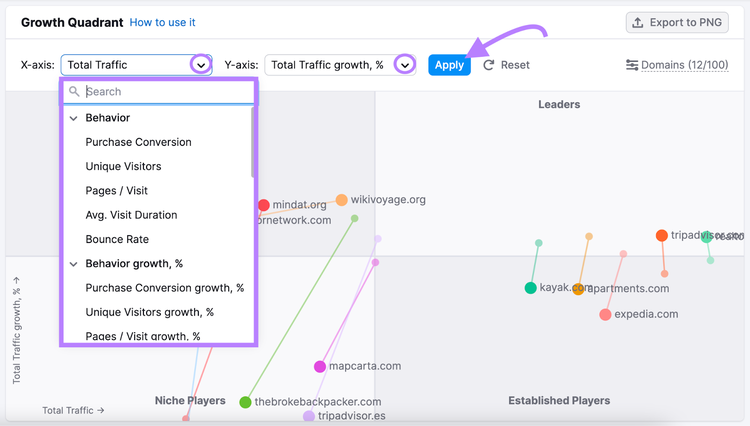
Now, see where you (and your main competitors) stand for your selected metrics.
Note the key metrics where your competitors are stronger. And use the insights to plan your growth strategy.
Further reading: What Is a Competitive Analysis & How to Do It (With Template)
Analyze Your Market
with the Traffic & Market Toolkit
2. Competitor comparison chart
A competitor comparison chart (also called a competitive landscape chart) is typically a table used to compare your products, services, or tactics against those of your competitors.
Like this:
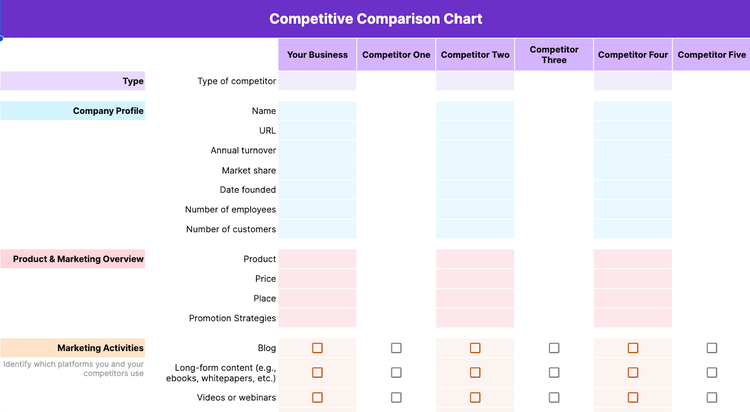
This competitor matrix is especially useful for a broad competitive analysis. Because the side-by-side comparison gives you quick insights such as:
- The strengths and weaknesses of your competitors’ go-to-market strategies
- Your competitors’ relative presence in specific marketing channels
- Your competitors’ most successful acquisition channels
Use the competitive comparison chart template (the second tab) to create your own.
You can also use comparison charts for narrower analyses (e.g., product or feature comparisons).
Which can be useful for:
- Product or service development: Identify gaps in the current market, improve your offerings, and establish a strong differentiator
- Marketing and sales: Fine-tune your messaging to highlight your unique value proposition
- Strategic decision-making: Guide decisions about pricing models, feature development, partnerships, and acquisitions
Or, identify a handful of areas that are most relevant to your business to focus your analysis on.
You can use the competitive landscape chart template (the sixth tab) to do this. And edit the fields to fit your needs.
3. Gartner's Magic Quadrant
Gartner’s Magic Quadrant compares how brands stack up in a specific technology market. And analyzes them on their ability to understand and influence the future of the market and their performance in key areas like market share, product capabilities, sales channels, and customer experience
Based on the above factors, each company is placed into one of the following quadrants:
- Leaders: These are well-established brands with strong execution capabilities. And a clear vision for the future of the market.
- Challengers: These brands have adequate resources and a strong ability to execute. But they need to work on vision.
- Visionaries: These players have a solid vision and intellectual properties. However, they’re comparatively weak or slow in execution.
- Niche players: These brands serve only a specific market segment. Or have a limited product portfolio.
One example is Gartner’s Magic Quadrant for DevOps Platforms. And the data within it can help you make informed decisions.
Let’s say your brand falls in the “Visionaries” quadrant. You have a disruptive idea but lack the resources to execute it.
That insight tells you where to focus.
And you could consider joining hands with a business in the “Challengers” quadrant. Since they need what you have—vision—you may be able to negotiate a good partnership.
Just remember that the Gartner Magic Quadrant Matrix is a snapshot. Not a definitive ranking.
Pro tip
Use this tool in combination with other research methods. Vision and execution are crucial. But they aren’t the only factors to consider when making strategic decisions about investments, partnerships, or acquisitions.
4. SWOT analysis
A strengths, weaknesses, opportunities, and threats (SWOT) competitor analysis matrix evaluates a company’s internal strengths and weaknesses. Plus external opportunities and business threats.
It helps you:
- Identify and use your strengths (e.g., strong brand awareness) to outperform competitors
- Know and address your weaknesses (e.g., poor customer service). Before they cause damage.
- Spot and grab emerging opportunities (e.g., new market segments)
- Foresee and avoid potential business threats (e.g., political instability)
Here are some questions to help you get your SWOT analysis data:
- What do you do well?
- What have your customers or partners said they like about you?
- In what areas do you outpace your competitors?
- What's unique about your business, products, or services?
- What assets do you own (intellectual property, proprietary technology, capital, etc.)?
- What can you improve?
- What are your customers or partners dissatisfied with?
- Where do you fall behind your competitors?
- Where are you lacking in knowledge or resources?
- What emerging trends can you take advantage of?
- Which of your strengths might be valuable to potential partners?
- What adjacent markets might you tap into?
- Are there geographic locations with less competition?
- What is your competition doing?
- How could your weaknesses leave you vulnerable?
- What market trends are you unprepared for?
- What economic or political issues could impact your business?
Gather your leadership team and brainstorm SWOT questions and answers. This way, you’ll get diverse perspectives from multiple stakeholders at your organization.
Then, compile your results in this SWOT analysis template (the fourth tab).
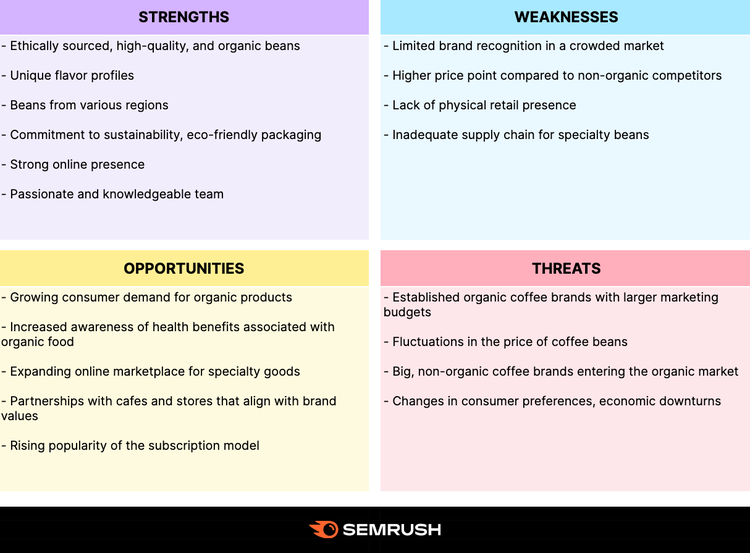
Here’s an example SWOT for a newly launched, fictional organic coffee brand called The Conscious Bean.
Further reading: SWOT Analysis: What It Is & How to Do It [Examples + Template]
5. Competitive profile matrix
A competitive profile matrix helps you benchmark your offering directly against major competitors. To provide a more nuanced view of how you compare overall.
It focuses on rating competitors on critical success factors (CSFs) by using a weighted scoring method.
Here’s how it works:
- List three to four main competitors you want to evaluate
- Determine your CSFs—these are key areas that drive success in your market. Like product or service quality, pricing, customer support, distribution network, or innovation.
- Assign weights between 0.0 (low importance) and 1.0 (high importance) to each CSF. The total weight must add up to 1.0.
- Rate competitors across all CSFs on a scale of 1-4 or 1-5. A higher rating indicates stronger performance for that CSF.
- Multiply the weight by the competitor's rating for each CSF to get a score. Add individual CSF scores for each competitor. It’ll give you a total weighted score.
Here’s a simplified competitive profile matrix example.
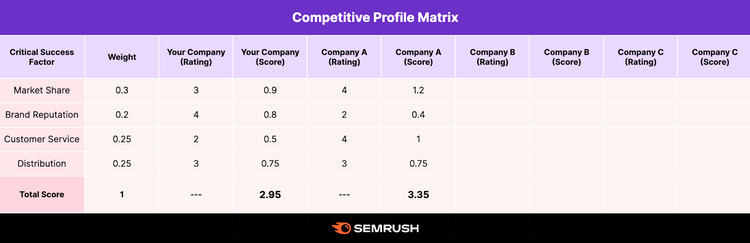
How do you interpret this table?
The company with the highest total score is typically the strongest.
So, make sure to examine how you rank in each CSF compared to others. And revise your strategy accordingly.
Use this competitive profile matrix template (the fifth tab) for your analysis.
How to create your own competitive matrix
To complete a matrix, you need to conduct competitor research and gather data—likely using competitive intelligence tools.
We’ll show you how.
Tip
Sign up for a free trial of Semrush to follow along with these instructions.
Elevate Your Digital Strategy
with a Semrush Subscription
Step 1. Identify Your Competitors
Start with a list of all potential competitors—direct, indirect, and emerging players in your market.
Find them using resources like:
- Industry reports
- Company websites and press releases
- Customer review platforms
- Social media and online communities
- Trade shows or conferences
- Customer surveys
Or simply head to the Market Overview dashboard (part of the Traffic & Market Toolkit) and enter a few competitive domains.
Once you’ve added a few domains, the dashboard will autosuggest additional domains in that marketplace.
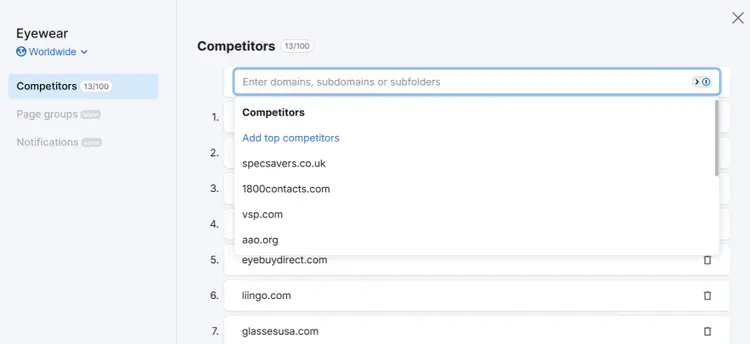
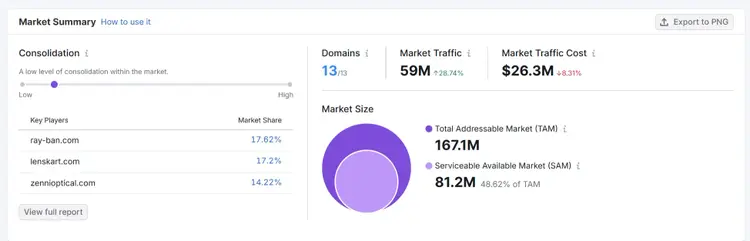
Once you’ve entered your desired domains, you’ll immediately see the Market Summary section. This summary displays market size, consolidation, and key players.
Scroll down to reach the Growth Quadrant chart.
You’ll see the competitive landscape along with competitors' positions in the market.
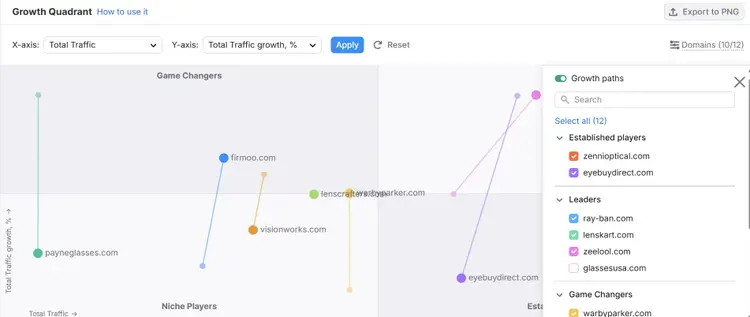
Now, identify your quadrant (“Leaders,” “Established Players,” “Game Changers,” or “Niche Players”). And click “Domains” near the top right corner of “Growth Quadrant.”
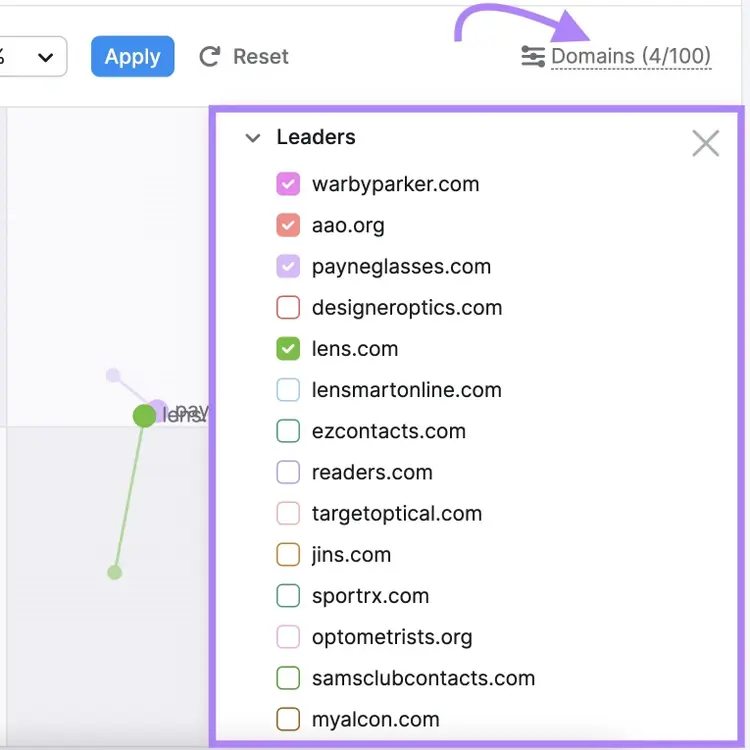
You’ll see the full list of the competing domains in your market.
Scroll to the list of domains in your same quadrant and select a few for your analysis.
Note
For more information on which competitors to choose for your analysis, read our guide to digital marketing competitor analysis.
Analyze Your Market
with the Traffic & Market Toolkit
Step 2. Determine comparison factors
Next, select comparison factors based on your competitive analysis goals.
They’ll guide your research. And help you choose the right competitive matrix type for your analysis.
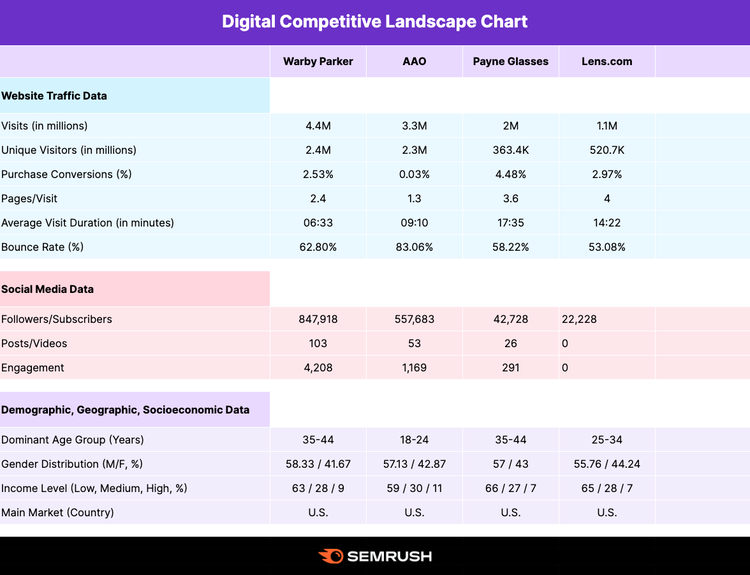
For our example, we’ll look at the following factors:
- Website traffic data: Visits, unique visitors, purchase conversions, pages viewed per visit, visit duration, and bounce rate
- Social media data: Followers/subscribers, posts/videos, and engagement rates
- Demographic, geographic, and socioeconomic data: Dominant age group, gender, income level, and main market
Then, add you/your competitors and your comparison factors to a copy of the matrix template that works best for your situation. In this case, we recommend using the competitive landscape chart (the sixth tab).
Step 3. Gather data
Now, you’ll need to collect the data that corresponds with your comparison factors to fill in the matrix.
Here’s what that entails based on the ones we identified above:
Website traffic data
We’ll use the Traffic Analytics dashboard in the Traffic & Market Toolkit to get the website traffic data.
Enter your competitors’ domains, as well as the timeframe, frequency, region, and devices you’d like to track.

You’ll instantly receive traffic metrics among your competitors. To download any chart on the Traffic Overview dashboard as a PNG, CSV, or Google Sheet, click the “Export” button.
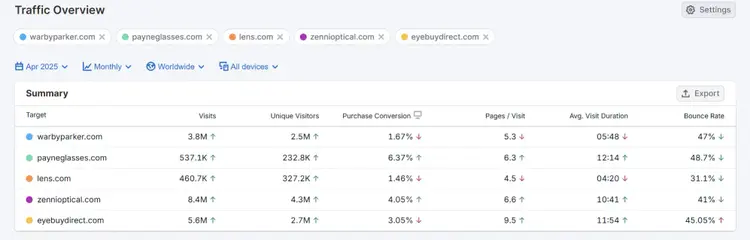
Or paste it directly into your template copy.
Analyze Competitors’ Traffic
with the Traffic & Market Toolkit
Social media data
Now, let’s go over how to get competitors’ social media data using the Social Tracker tool, which is part of Semrush’s Social Toolkit. It lets you track the social media activity and performance of up to 20 competitors.
Open the tool. And follow the Social Tracker configuration instructions.
At the top of the “Overview” tab, you’ll see the chosen competitor’s audience size, posting activity, and engagement on different social platforms.
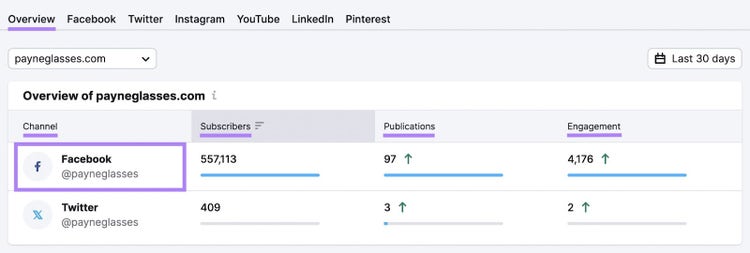
Note
The tool also allows you to dive into channel-specific reports for each competitor. For example, click the “Facebook” tab. To see more details about a competitor’s subscribers, posts, and engagement on Facebook.
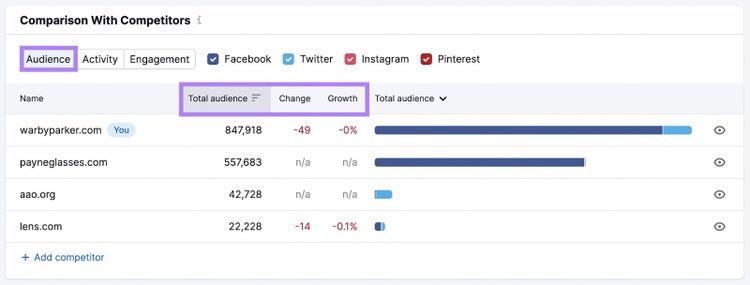
Scroll to the “Comparison With Competitors'' widget to see how you stack up against your competitors.
The “Audience” tab shows the total number of followers or subscribers across the social platforms. Including the changes in the audience size.
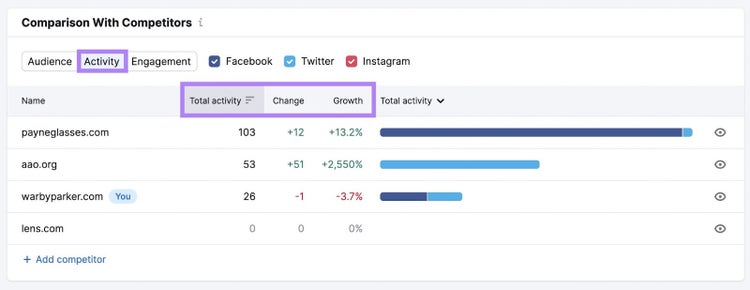
Click the “Activity” tab to see the total number of social posts of each competitor. For the selected period.
Similarly, analyze the total engagement.
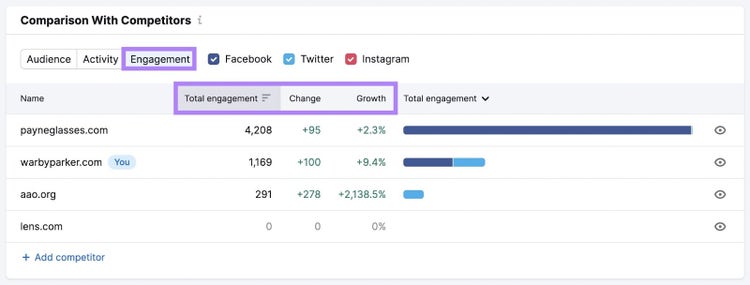
You can now add this data to your competitive landscape chart.
Further reading: How to Uncover Your Competitor's Social Media Strategy
Streamline Social Media Management
with a Semrush Social Subscription
Demographic, geographic, and socioeconomic Data
Comparing demographics can reveal valuable insights about your target audience.
Use the Demographics dashboard in the Traffic & Market Toolkit to find this information.

You’ll instantly get information about how your competitors rank with various age and gender groups.
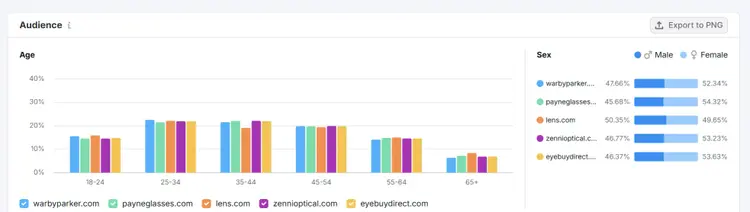
These insights can guide your product, pricing, and marketing strategy.
Step 4. Fill In the Matrix
Now that you’ve collected your data, simply add it to your comparison matrix. In this case, the competitive landscape chart.
It might look something like this:
Use your findings to gain a competitive advantage
The main goal of creating a competitive matrix is to turn data into insights you can act on to drive growth. But maintaining a long-term competitive advantage also requires an awareness of your competitors’ actions.
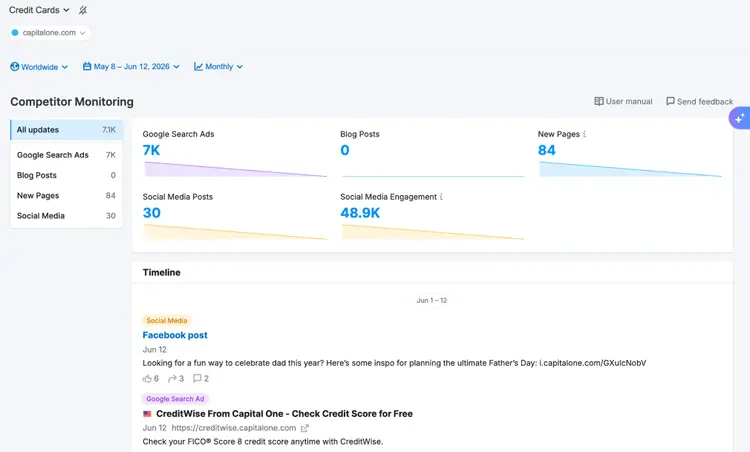
Use Semrush’s Competitor Monitoring dashboard to automate tracking your competitors’ online marketing activities. It keeps you updated on your competitors’ newly published pages, blog posts, Google ads, social media updates, and more.
Track Competitors’ Marketing Activities
Competitor Monitoring

Ravi is a data-driven content marketer, writer, and strategist with over 10 years of marketing experience. He helps B2B SaaS companies drive organic growth with product-led content and SEO.

Tells Google to show you more from Semrush in AI, Search, and Discover.