
Content Reporting Guide: Essential Metrics, Tools, and Examples
What Is Content Reporting?
Content reporting is the process of collecting, analyzing, and presenting data regarding content performance to inform strategy and decision-making.
This involves tracking various metrics like page views, engagement rates, conversion rates, and social shares to understand how content resonates with your audience.
Content reporting can also help identify trends, inform future content creation, optimize distribution channels, and help you make data-driven decisions.
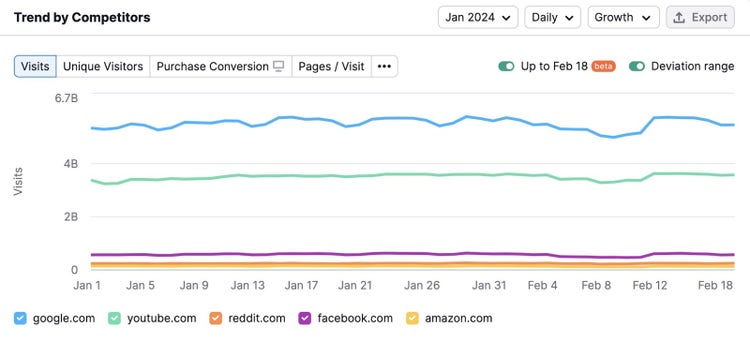
A genuinely helpful content marketing report goes beyond raw data alone. It also includes visuals. This is important for conveying information in an easy-to-understand way.
For example, Semrush’s Traffic Analytics tool features a graph that compares competitors’ organic traffic across several sites:
Why Are Content Marketing Reports Important?
As a marketer, you need reports to measure the results of your content strategy.
But content marketing performance is only the beginning.
A successful report also provides insights into attribution (which channels drove the traffic) and return on investment (ROI). Both metrics are critical for demonstrating value.
Here's how content reports can help:
- Performance measurement: Determine how many people read your content and how much time they spend engaging with it
- Channel attribution: Learn which marketing channels contribute to the most clicks and conversions
- Audience analysis: Discover the topics that appeal to your audience and the search intent (reason behind a keyword search) that drives the best outcomes
- ROI evaluation: Understand which content, topic, and channel drives the most value so you can adjust your marketing budget accordingly
- Strategy optimization: Leverage the findings from your content performance report to iterate and improve your marketing strategy (i.e., if your findings reveal YouTube traffic has a high conversion rate, you might funnel more money into YouTube videos)
Essential Metrics for Content Reporting
The metrics below are a good starting point for a content performance analysis.
Don't hesitate to build on this initial list. Include other content marketing metrics that matter to your team and stakeholders.
1. Website Engagement Metrics
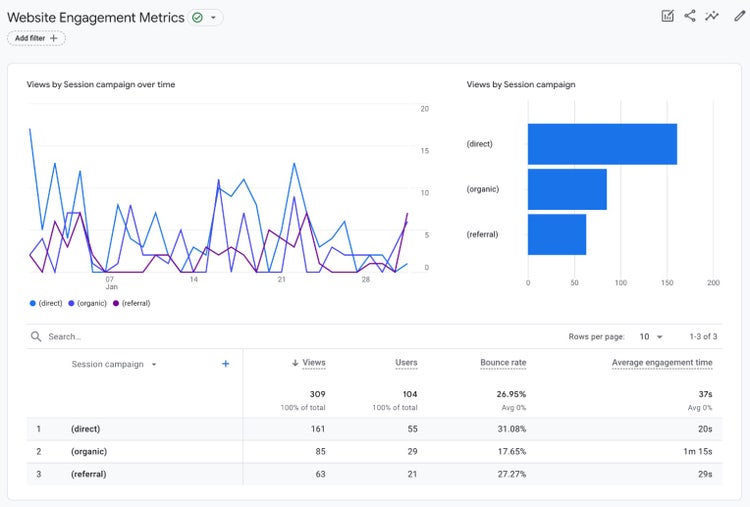
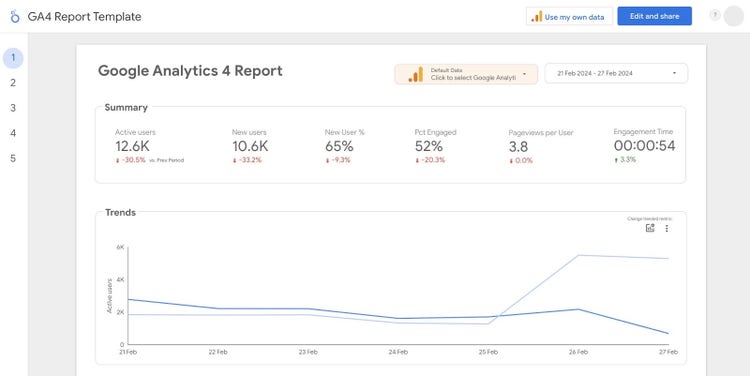
Website engagement metrics, like the example above from Google Analytics, indicate how visitors experience your site content.
These metrics offer a helpful overview of page traffic and on-page engagement.
For example:
- Page views: The number of visits logged for a particular page or blog post. This metric can include multiple views from the same repeat visitor.
- Unique visitors: The number of individual people who viewed a page or blog post. When you want to maximize website visitors, monitor this metric.
- Bounce rate: The percentage of visitors who weren’t engaged with your site. In other words, visitors who spent 10 seconds or less on your site, had less than two page views, or didn’t have a conversion event. Lower bounce rates reflect more internal link clicks and may signal more engaging content.
- Average time on page: The amount of time visitors spend on a particular page or blog post. A higher average time on page reflects a higher level of interest and may suggest intent.
Further reading: Learn how to set up Google Analytics 4 for your website and analyze key metrics in this GA4 Guide for Beginners.
2. Conversion and Performance Metrics
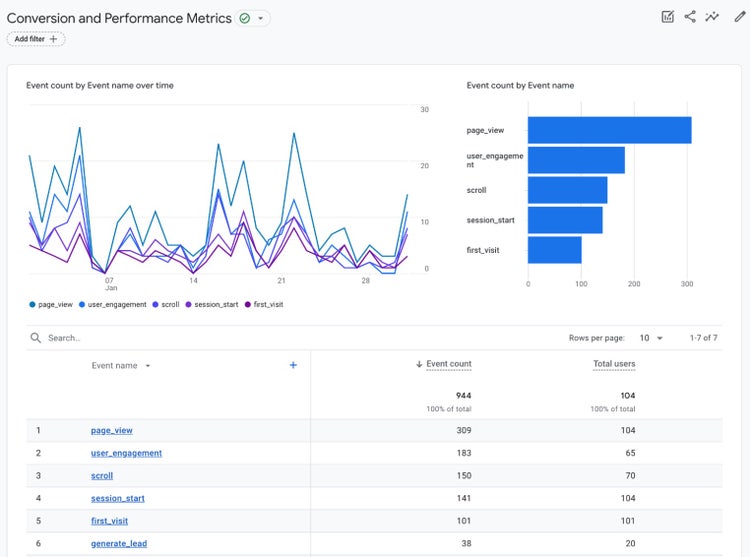
Conversion and performance metrics, like you can see above in the Google Analytics example, reflect how well your content drives clicks and conversions and generates a return.
These metrics are closely tied to value and business goals.
For example:
- Click-through rate (CTR): How often a user clicks to visit your site from a search engine results page (SERP). A higher CTR usually means your content aligns with search intent.
- Conversion rate: How often a website visitor completes an action like a subscription or a purchase. Measuring conversion rates helps with assessing your content's business value.
- ROI: How the income (i.e., return) compares to the original investment. This metric is critical for identifying your most valuable content.
3. SEO and Outreach Metrics
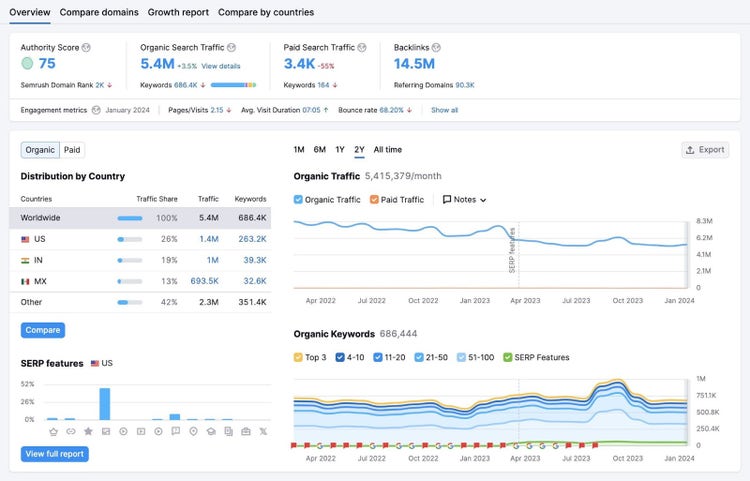
Search engine optimization (SEO) and outreach metrics reveal the results of keyword and link-building strategies.
In the example above from the Domain Overview competitive analysis tool, you can see a detailed report on the site’s Authority Score, backlinks profile, and organic traffic.
Knowing this information helps you optimize your keyword portfolio and public relations efforts.
Here are some crucial SEO and outreach metrics to track:
- Backlinks and referral traffic: How many other webpages link to your content? More SEO backlinks and referral traffic suggest that other website owners find the content useful.
- Keyword rankings: Your ranking position on SERPs for relevant keywords. You want to rank as close to the first position as possible for critical keywords.
- Brand mentions: The number of times another website references your brand. Mentions don't always include links, but they do present link-building opportunities.
- Organic traffic growth: How much your website's organic search traffic increased during a set time. Steady growth indicates effective content marketing efforts.
Get Content Reporting Insights into Competitors & Clients
with the Domain Overview Tool
4. Social Media Metrics
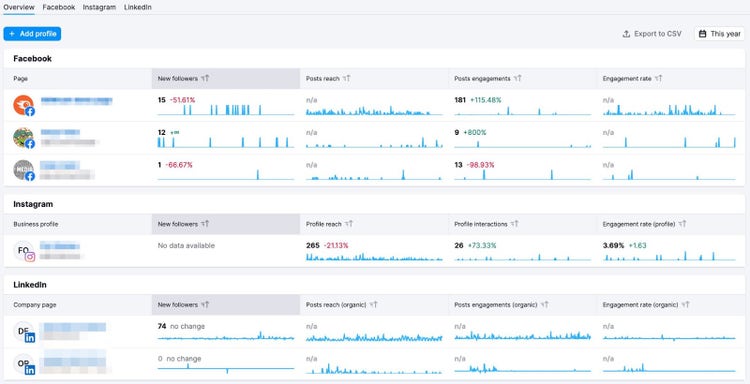
The report above is from the Social Analytics tool. It gives you an easy way to report on metrics like new followers, post reach, and engagement.
Why is this important? Social media metrics show how people interact with content when you share it on social media platforms. These metrics reveal how your content affects growth and activity across your social accounts.
For example:
- Social media engagement: How many times social media users liked or commented on your content. Measuring engagement rate helps you compare engagement to reach (the number of users who saw your content).
- Social media shares: The number of times social media users shared your content to their own feeds or timelines. This metric suggests a higher level of intent (user's interest in your brand) than other engagement metrics.
- Audience growth rate: How much your social media following grew during a set period. Over time, follower growth can lead to increased reach and engagement.
5. Content Reach and Impact Metrics
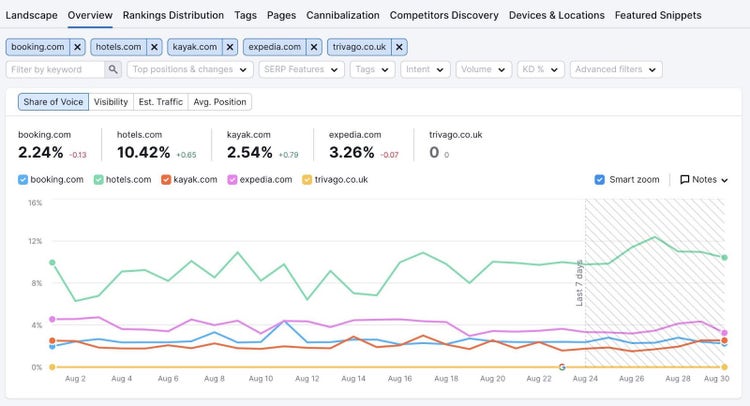
Content reach and impact metrics measure how many people view and engage with your content. They help quantify your content's total impact.
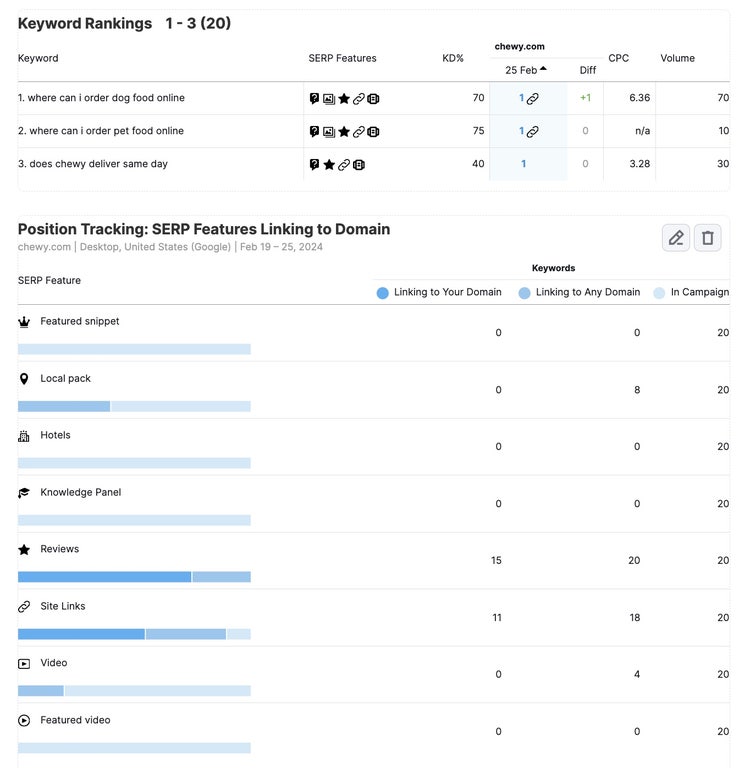
Tools like Position Tracking, which you can see in the screenshot above, let you analyze share of voice. Social Analytics helps you track post engagement.
Metrics include:
- Content reach: The total number of people who view your content. This metric spans search, social media, and other distribution channels to offer a broad overview.
- User comments and feedback: The number of people who left comments on your blog posts. A lot of comments often signal a higher level of engagement and interest in your brand.
- Share of voice in industry topics: How much of the market your brand owns compared to the competition. This metric helps quantify and compare visibility with competitors.
8 Best Content Reporting Tools
What's the right content reporting tool for you?
It depends.
Which content metrics do you need to track? Do you prefer premade reports or customanalytics dashboards?
Let's look at some of the most popular reporting tools for marketers.
1. Semrush Position Tracking
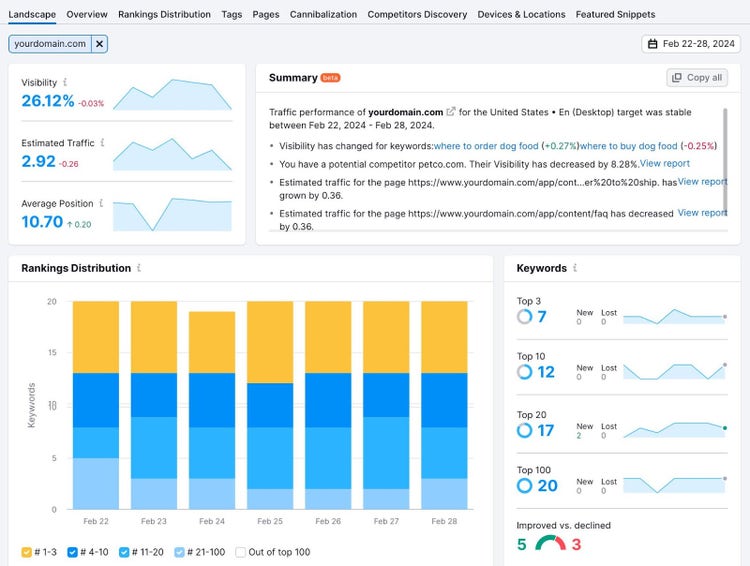
Semrush's Position Tracking tool shows SEO and keyword ranking metrics.
Its premade reports offer a complete overview of metrics like:
- Visibility
- Rankings distribution
- New and lost keywords
- SERP features
- Top-performing pages
- Share of voice
The Position Tracking tool supports PDF exports for sharing with colleagues and stakeholders.
But you can also sync it with Google's Looker Studio. We'll cover Looker Studio in detail below.
Track Your Rankings for More Insightful Reporting
with the Position Tracking Tool
2. Semrush Backlinks
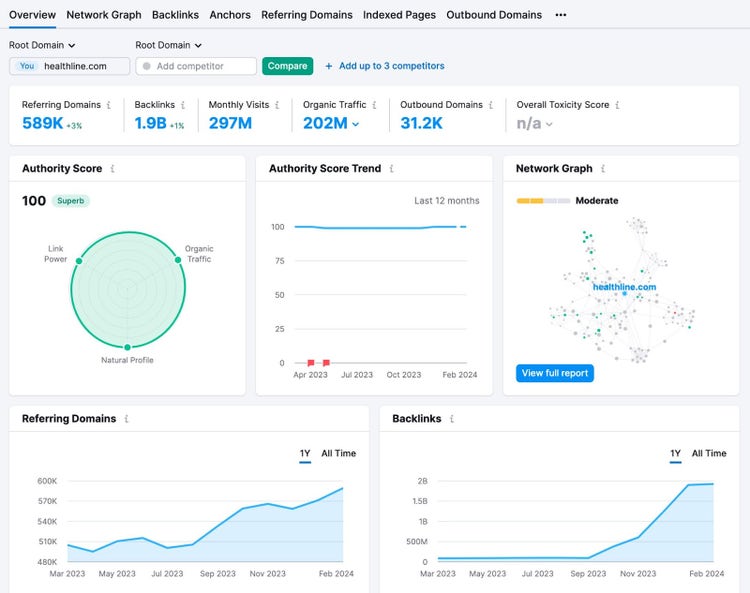
Semrush Backlinks tool reports on outreach metrics. These premade reports are helpful for collecting data on:
- Backlinks
- Referring domains
- Anchor text
- Link attributes
It also has a comparative tool. It can measure your website's backlink portfolio against the competition.
3. Google Analytics
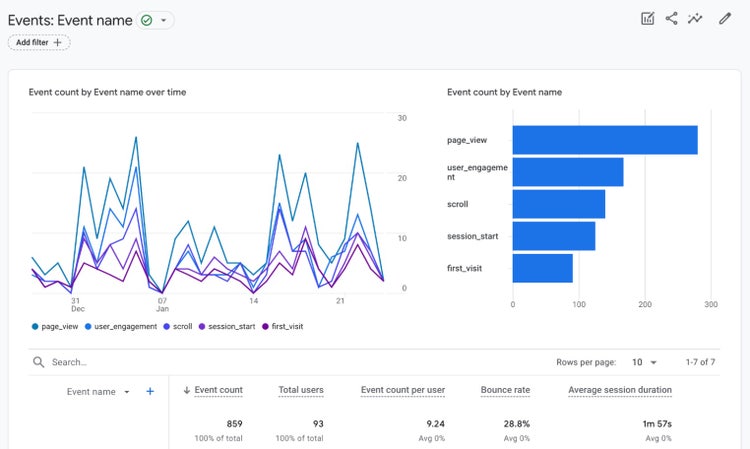
Google Analytics is a website analytics tool that measures content performance and engagement.
The platform's default setup is helpful for monitoring:
- Page views
- Unique visitors
- Bounce rate
- Average time on page
You can also configure Google Analytics to track content website conversion rates. For example, customize reports to track newsletter signups and ecommerce sales.
Because this platform can track conversion value, it's also useful for ROI reporting.
4. Google Search Console
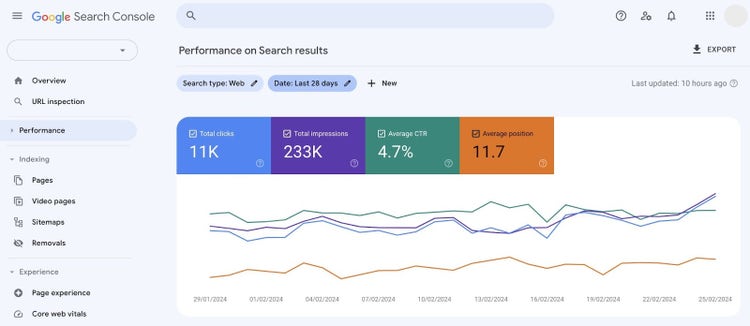
Google Search Console reports on search performance and organic traffic.
Its report templates are helpful for tracking metrics like:
- Impressions on SERPs
- Clicks from SERPs
- CTR from SERPs
5. Semrush Organic Traffic Insights
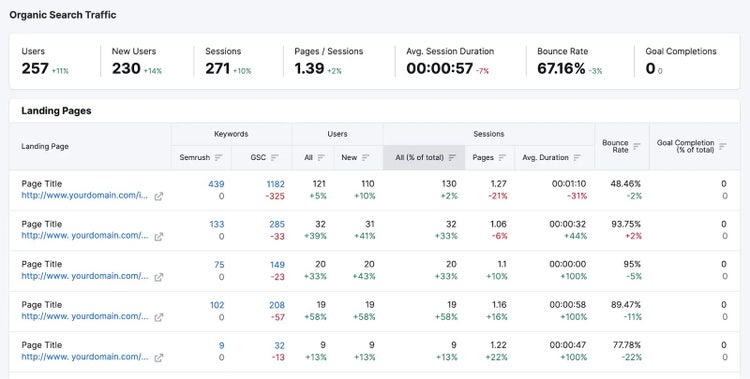
Semrush's Organic Traffic Insights tool connects to Google Analytics and Google Search Console.
Since it sources data from both tools, it displays combined metrics in premade reporting templates.
This makes it helpful for tracking:
- Organic search traffic
- Average engagement time
- Engagement rate
But Organic Traffic Insights doesn't just show data from Google products. It also uses Semrush data.
Which means it's also a good source for keyword metrics. The dashboard reveals total keywords and changes over time.
6. Semrush Social Analytics
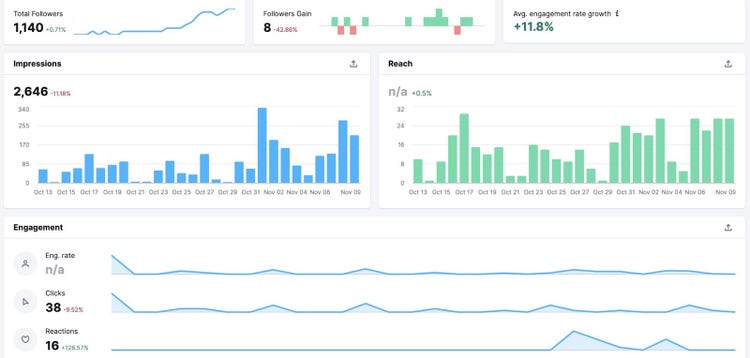
Semrush's Social Analytics displays social media analytics for Facebook, Instagram, and LinkedIn.
Discover how many people responded to your content or followed your account.
Its templates show metrics like:
- Post engagement
- Engagement rate
- New followers
Social Analytics also reveals how many people saw your social media posts or profile. This is ideal for measuring reach.
7. Semrush My Reports
Most of the tools above show data for one platform or channel. Semrush's My Reports feature is a little different.
My Reports displays analytics from multiple sources.
For example, it can sync with:
- Semrush
- Google Analytics
- Google Search Console
This feature has premade reporting templates. But it also lets you build custom reports from scratch.
In the next section, we'll walk through the steps to build a custom report with My Reports.
8. Google Looker Studio
Looker Studio is a reporting tool that displays data from dozens of tools. For example, it syncs with Google products like:
- Google Analytics
- Google Search Console
- Google Ads
- Google Sheets
It also integrates with third-party tools like Semrush. That means Looker Studio can report on:
- Website performance
- SEO
- Outreach
- Conversions
- Social media marketing
- Email marketing
Once you connect your data sources to Looker Studio, use the platform's premade templates to create reports quickly.
But that isn't your only option.
You can also build custom reports that show the exact data you need to share with your team.
Further reading: How to Build an SEO Report (Plus Templates)
A Step-by-Step Guide to Creating Content Reports
Put your preferred reporting tool to work. Use this step-by-step guide to create a workflow for content performance analysis.
1. Identify Key Reporting Goals
First, define the report's main objective(s). Set clear objectives that align with your organization's business goals.
Unsure where to begin? Use the SMART marketing objectives framework.
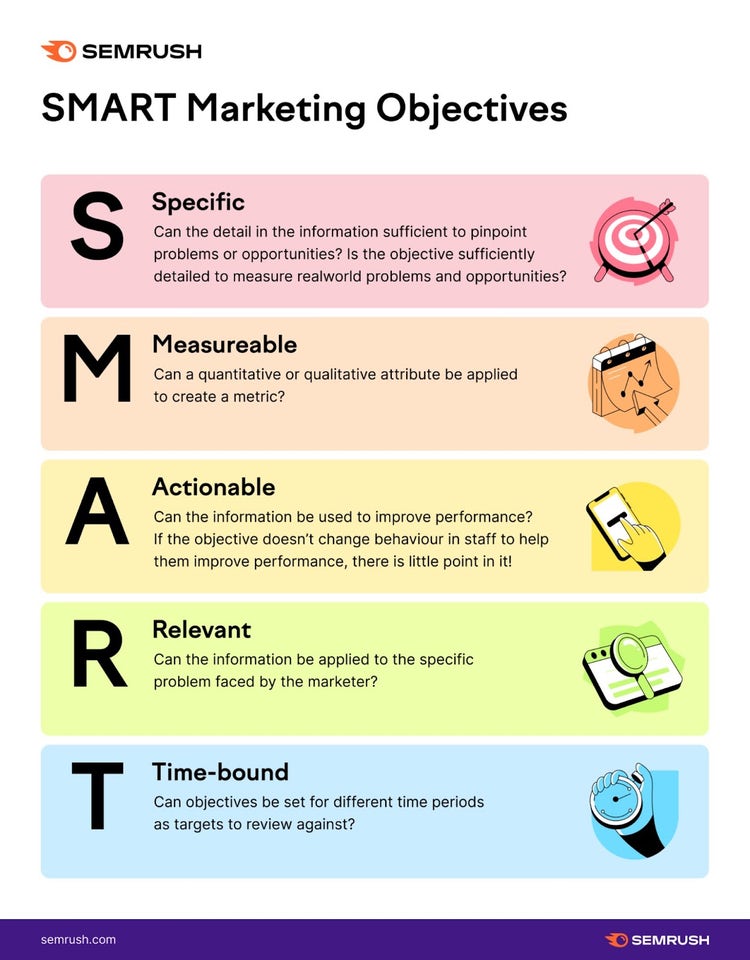
Here's an example of how a SMART marketing objective could look in practice:
Say your team has a quarterly revenue goal that's 10% higher than last quarter.
Most of your leads come from organic search, referral traffic, and social media. This means you need to focus on increasing traffic from at least one of these sources—and likely all three.
Now, you have the foundation for your report. You know what to report on (traffic and leads from three locations) and, more importantly, why it matters to your team (10% more revenue).
So, what should you measure?
Define key performance indicators (KPIs) and metrics.
2. Select Relevant Metrics and KPIs
Identify the metrics and KPIs that fit your objectives before preparing the report. This way, you'll know if you need a custom solution or if you can use a premade template that already includes your chosen metrics.
Use your objective to select relevant metrics.
Building on the example above, you could include:
- Organic traffic growth
- Backlinks
- CTR
- Page views
The metrics above would be enough to answer basic questions about SEO, content performance, and website engagement.
But stakeholders may also want to see more intent-based metrics that indicate interest in your business or plans to purchase. You could include average time on page, bounce rate, conversions, and ROI.
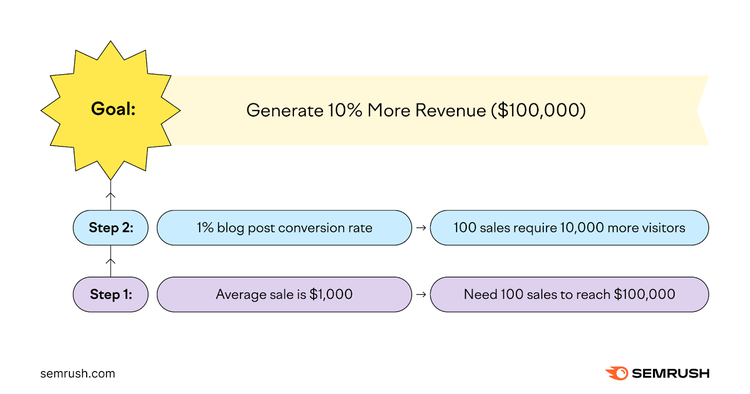
Set specific KPIs for each metric. Make your KPIs relevant by working backward from your business goal.
For example:
- You need to generate 10% more revenue, which equals $100,000
- An average sale is $1,000. This means you need to generate 100 sales.
- Your average blog post conversion rate is 1%. This means you need 10,000 more visitors.
3. Gather and Organize Data
Next, identify your data sources. Which ones provide the necessary data to measure relevant metrics and track KPIs?
Continuing with the example above, you may need to gather data from:
- Google Analytics
- Google Search Console
- Semrush's Organic Traffic Insights
- Semrush's Position Tracking
- Semrush's Backlinks
Define the timeframe for your content marketing reports. For example, will you produce weekly, monthly, or quarterly reports?
Create accurate reports incorporating multiple sources. Plan to collect data from each one at a consistent time.
4. Use Content Marketing Reporting Software
To produce content reports, choose the software that best meets your needs. Consider your preferred metrics and data sources.
If you need to access a single data source, choosing the right software is easy. One of the platforms we covered above is likely to meet your needs.
But, the choice can be trickier when you need to report on multiple data sources.
Rather than using multiple tools, consider using a single tool for custom reporting. Semrush's My Reports is an efficient solution.
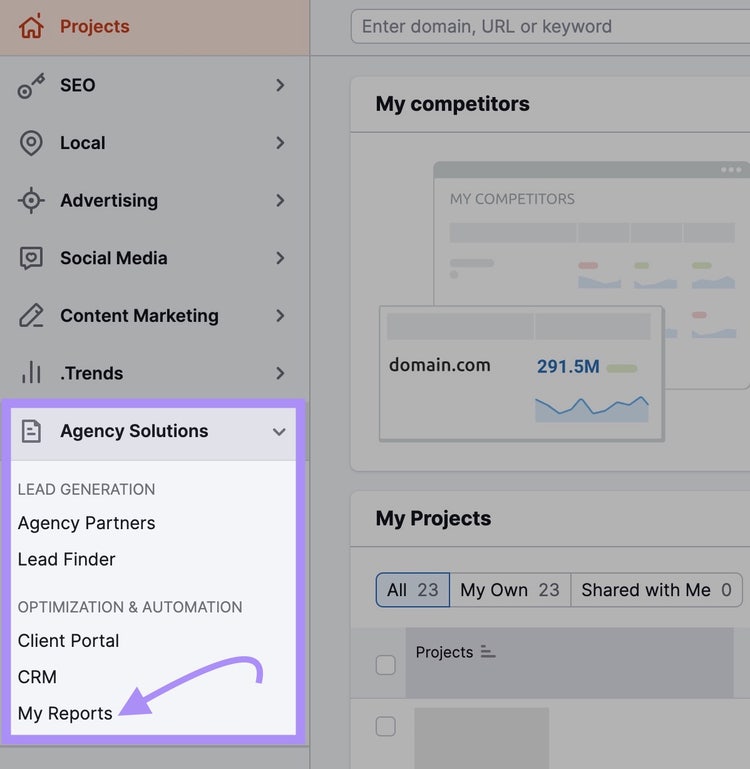
To create a custom report, go to your Semrush dashboard. Click the “Agency Solutions” drop-down to find "My Reports."
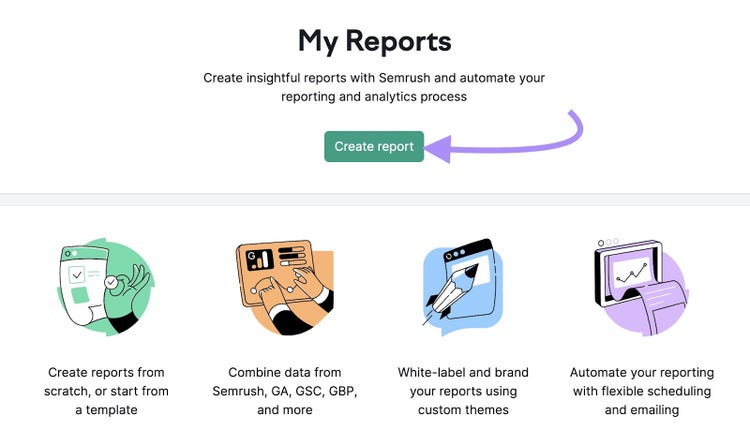
Click the "Create report" button.
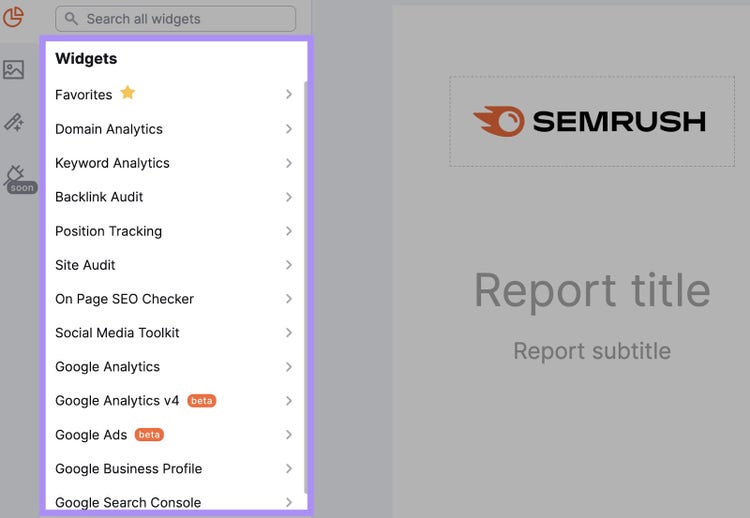
Use the left navigation to locate the data sources you need to reference. Drag and drop relevant widgets from the list to the report.
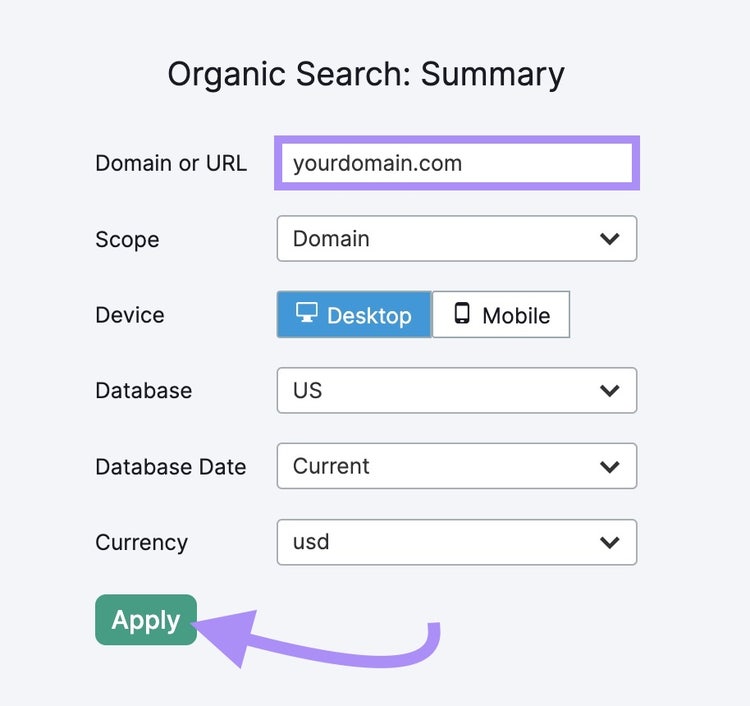
Each time you add a data source, you'll need to configure the settings. Usually, that means selecting a relevant account. Click "Apply" to add the widget to your dashboard.
Return to the list of widgets and repeat the process until you add all relevant metrics. Drag and drop them into your preferred order.
5. Include Visuals to Improve Understanding
A content report should include more than raw data. Incorporate visuals like charts and graphs.
Why is this important? Data visualization is much more effective for conveying information. It's also helpful for highlighting patterns and trends.
My Reports has several visualization types. When you use My Reports to create custom reports, pay attention to the icon next to each widget in the left-hand menu.
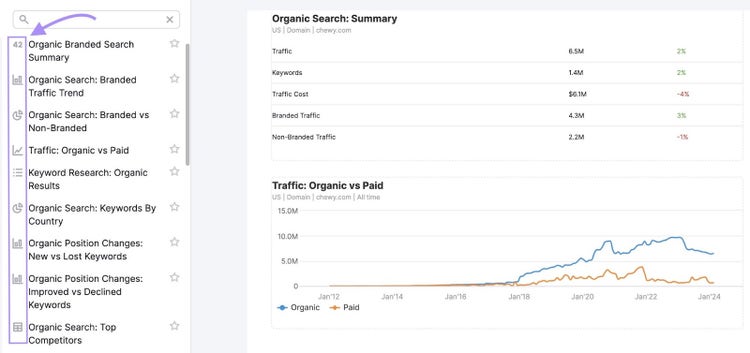
Each icon indicates whether the widget shows data, a chart, or a graph.
Here's an example:
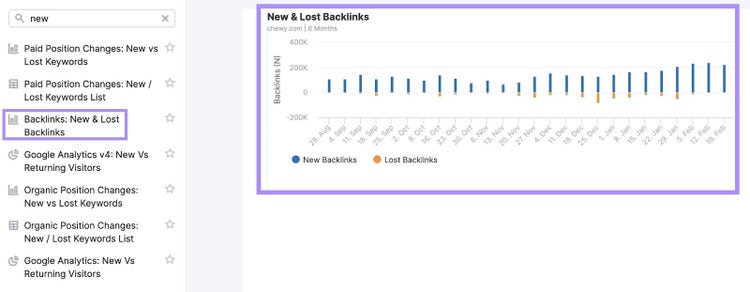
The icon for “New & Lost Backlinks” is a graph, and this report section displays as a bar graph.
6. Analyze and Interpret the Data
Next, review the report and analyze the data. What does the data tell you?
More importantly, what should you do about it?
Identify actionable insights, or specific action items you or your team can immediately implement. For example, what steps can you take to drive more traffic to a specific page?
Here are some questions to guide you:
- Did you meet the KPIs you set? Are you on track to meet them within the timeframe?
- If not, how do you intend to correct course? Outline a course of action.
- Does the data show any trends? Do they make it more or less likely you'll meet your content goals?
- Which channels or pieces of content contributed the most value? Can you pinpoint why?
- What's the ROI of your content marketing efforts? How has it changed over time?
7. Craft a Compelling Narrative
Turn your notes into a narrative you can share with stakeholders.
Use a framework like this:
- Start with the big picture: Outline the main goal and your team's progress
- Highlight where your efforts succeeded: Explain how you'll incorporate this data to improve your content marketing strategy
- State where your efforts failed: Clarify what changes you'll make to get your efforts back on track
- End on a positive note: Summarize your team's next steps
Here’s a simple example of how your narrative could look:
Overview
Our main goal for Quarter 1 is to increase revenue by 10%, which equals $100,000. At the end of the first month of the quarter, we already increased revenue by 5%, or $50,000.
Highlights
Our biggest win has been increasing traffic to three high-performing landing pages. During the first month of the quarter, these pages successfully converted 50 new customers.
All three pages attract a combination of organic search and social media traffic. I recommend revisiting our content distribution strategy. We can find more opportunities to share these pages from our social media accounts and drive even more traffic.
Failures
One of the landing pages we published this quarter failed to convert customers. The content team should review this page to confirm it aligns with search intent.
Summary
We’re ahead of schedule to meet our Quarter 1 goal. By finding more opportunities to double down on what’s working, we should be able to meet or even exceed the goal.
8. Finalize and Distribute the Report
To finalize your report, review it for accuracy.
Did you include all essential metrics? Did you select the right timeframes?
You're good to go.
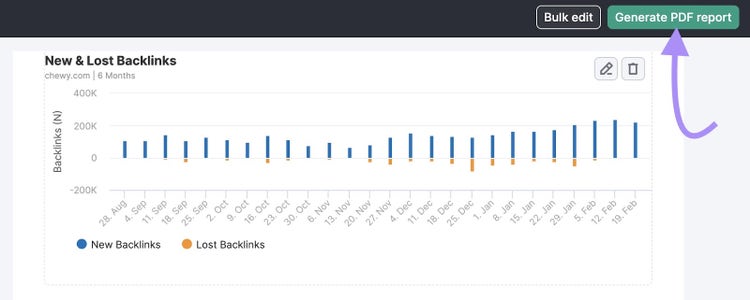
For example, if you’re using My Reports, click the "Generate PDF report" button in the upper right corner.
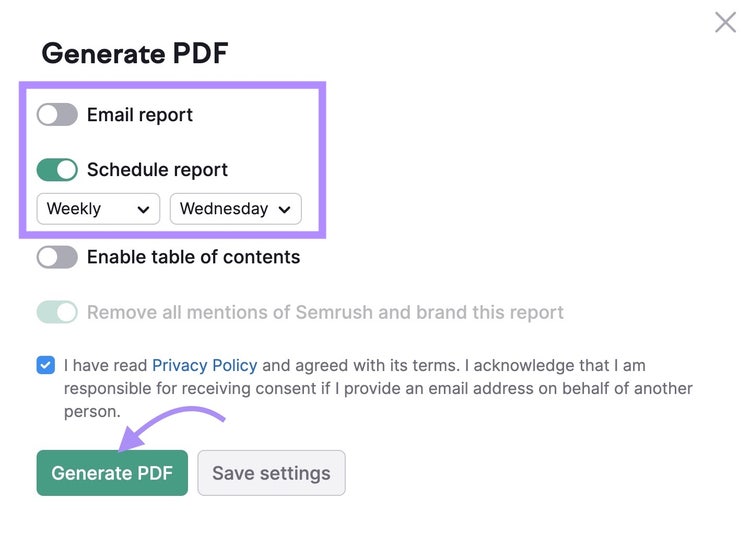
Use the toggles to adjust the report settings. Either email the report now or schedule it to send daily, weekly, or monthly.
Don't forget the narrative you composed.
You have two options:
- Copy and paste the narrative into an email and attach the report
- Create a screen recording and share your thoughts in a video message
9. Get Feedback and Optimize
Make your content reports as useful and actionable as possible. How? By paying close attention to stakeholder feedback.
- Does your team have questions the report doesn't answer? Update the report format or plan to touch on the issue in future narratives.
- Does your team find the report overwhelming? Consider removing vanity metrics or sections that don't relate to your marketing or business goals.
Remember: Reports shouldn't be static.
Listen to stakeholder feedback and continue to improve your process. Then, you can create reports that generate more value for your team.
Content Reporting Examples and Templates
Semrush's My Reports and Google's Looker Studio offer premade content report templates. Use them as-is or as inspiration for creating custom reports.
Pro tip
Access Semrush’s reporting templates on your main My Reports dashboard. Scroll down to search templates or create your own. You’ll find Looker Studio’s template gallery on the main Reports dashboard.
Organic Search Positions Template (Semrush My Reports)
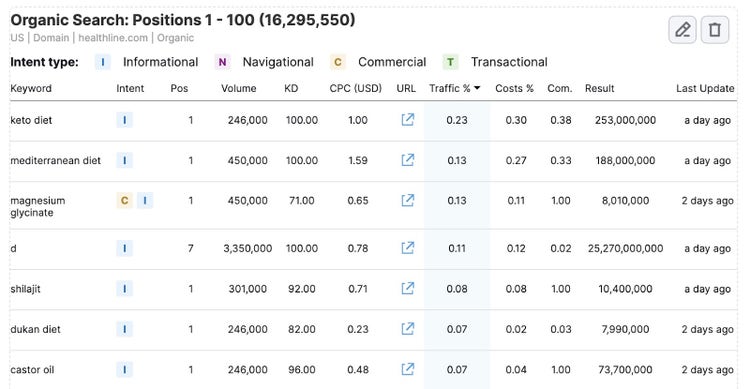
Monitor your keyword performance with this Semrush template.
Along with organic search positions, it also includes:
- Keyword volume
- Keyword difficulty
- Traffic share
- Search intent
To make this report more visual, select any of the data sources in the My Reports menu. Drag and drop your choice of graphs into the report.
Backlinks: Full Report Template (Semrush My Reports)
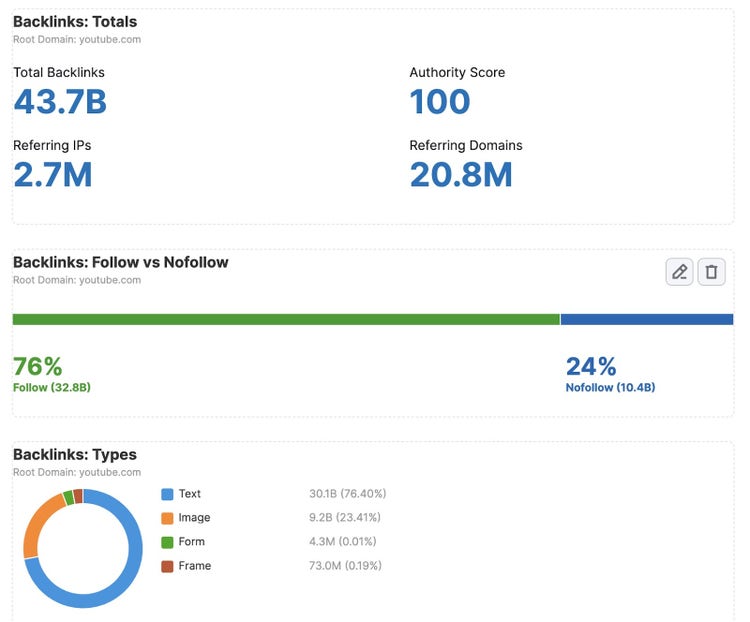
Track everything you need to know about how your backlinks compare to the competition.
This report template includes:
- Backlink totals
- Backlink types
- Top referring domains
- Top indexed pages
This template also features a direct comparison chart. With a quick glance, identify which site comes out on top for total backlinks, referring domains, and authority score.
Google Search Console Template (Looker Studio)
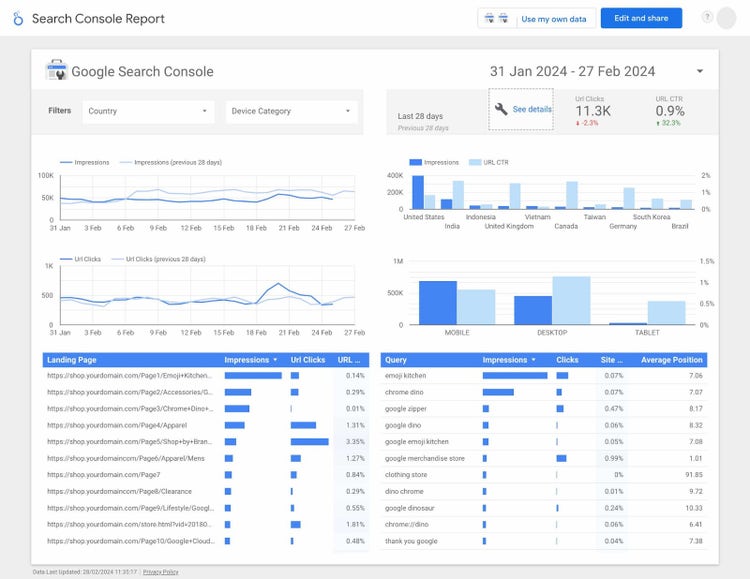
Monitor all the Google Search Console metrics that matter to your team from a single dashboard.
This Looker Studio template includes:
- Impressions
- Clicks
- Device performance
- Landing page performance
- Search query performance
With these insights, you can better understand how your website performs in search. Identify what's working to improve your content strategy.
Google Analytics 4 Template (Looker Studio)
Track the website performance metrics your stakeholders care about from this Looker Studio template.
This Google Analytics template reports on:
- Users
- Page views
- Engagement time
- Traffic channels
- Conversions
This content report is ideal for understanding how visitors find your website. Use these insights to decide where to invest more of your content marketing budget.
Content Reporting Made Easy with Semrush
To understand how your content is performing, you need a reliable reporting workflow.
But you don't need to spend time compiling data or building reports manually.
Semrush can help you compile and analyze relevant data sources through customizable reporting templates. Create and share content reports with team members in minutes.
Start by creating a report today to monitor progress toward your goals.
Get Everything You Need for Content Reporting
with a Semrush Subscription

Sydney has been creating content for over 10 years. She has been a writer, content manager and coordinator, editor, and strategist. At Semrush, she’s a blog editor who makes sure each article is as accurate, optimized, and helpful as possible.

Tells Google to show you more from Semrush in AI, Search, and Discover.
Table of contents
-
A Step-by-Step Guide to Creating Content Reports
- 1. Identify Key Reporting Goals
- 2. Select Relevant Metrics and KPIs
- 3. Gather and Organize Data
- 4. Use Content Marketing Reporting Software
- 5. Include Visuals to Improve Understanding
- 6. Analyze and Interpret the Data
- 7. Craft a Compelling Narrative
- 8. Finalize and Distribute the Report
- 9. Get Feedback and Optimize