An analytics dashboard displays real-time performance metrics for a website, department, or project—usually in the form of interactive charts.
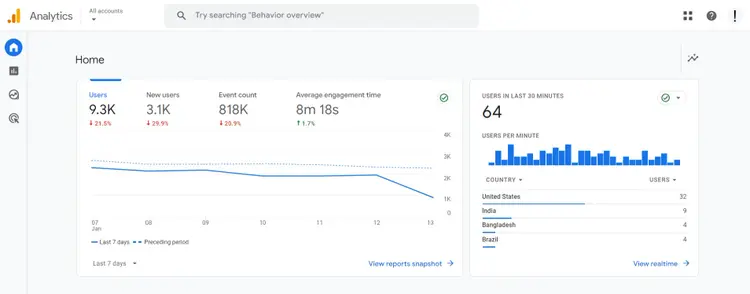
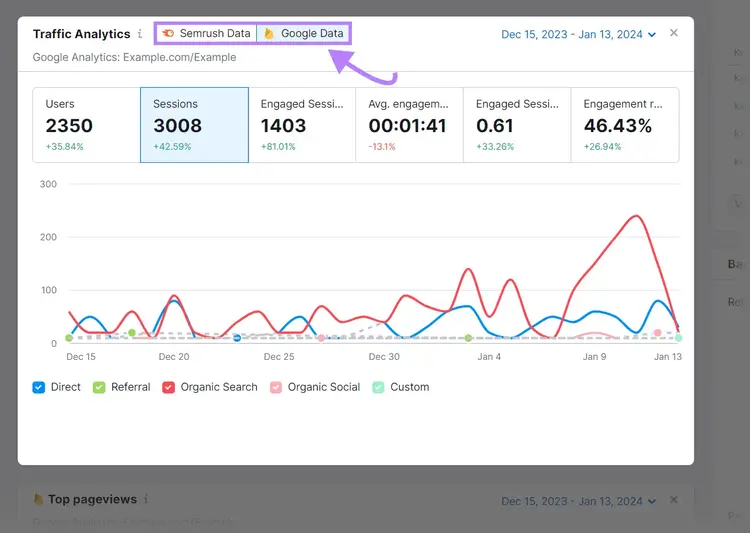
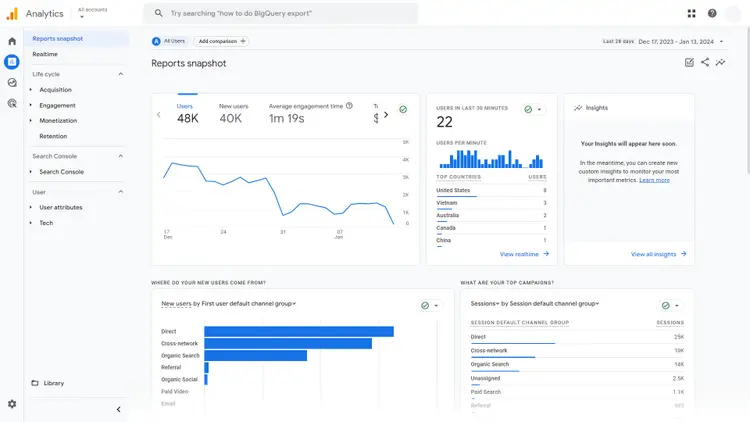
For example, Google Analytics allows you to build web analytics dashboards that visualize website traffic, conversion rates, etc.
Like this:
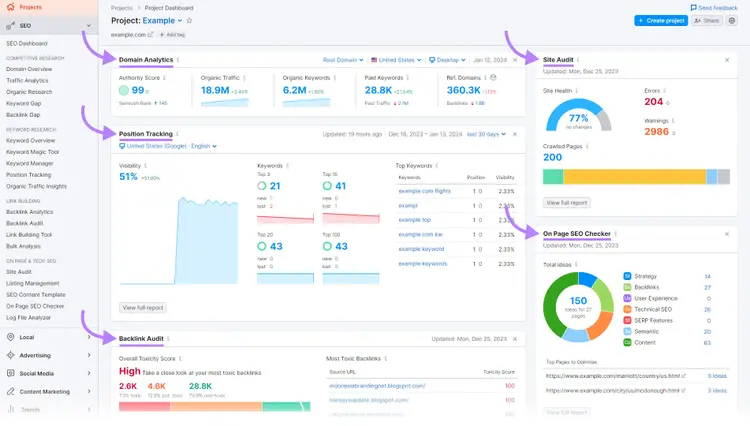
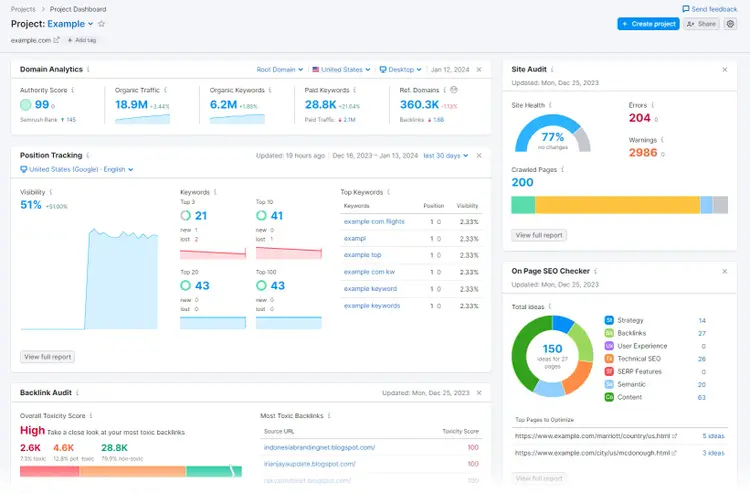
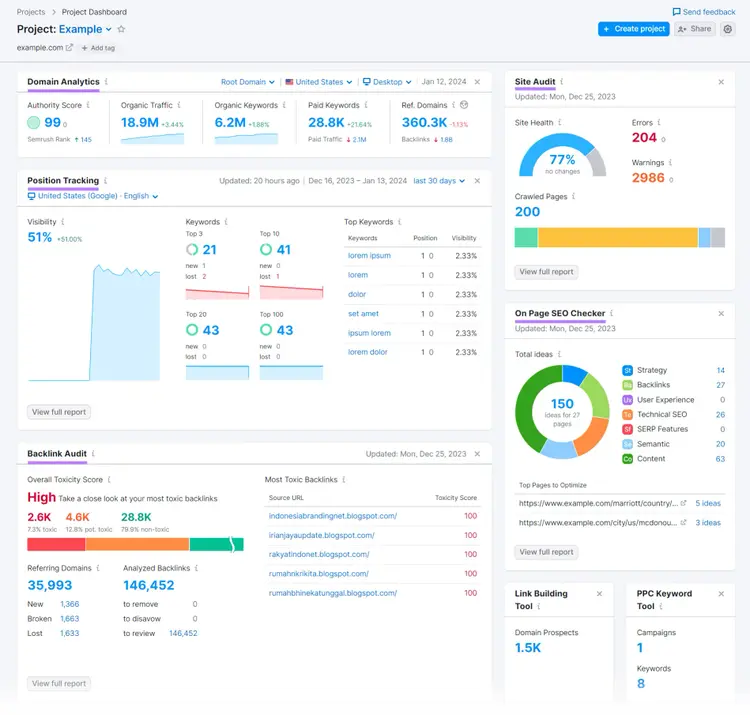
The Semrush Single Project Dashboard, on the other hand, shows you domain analytics, keyword positions, backlink metrics, site health, and on-page SEO suggestions.
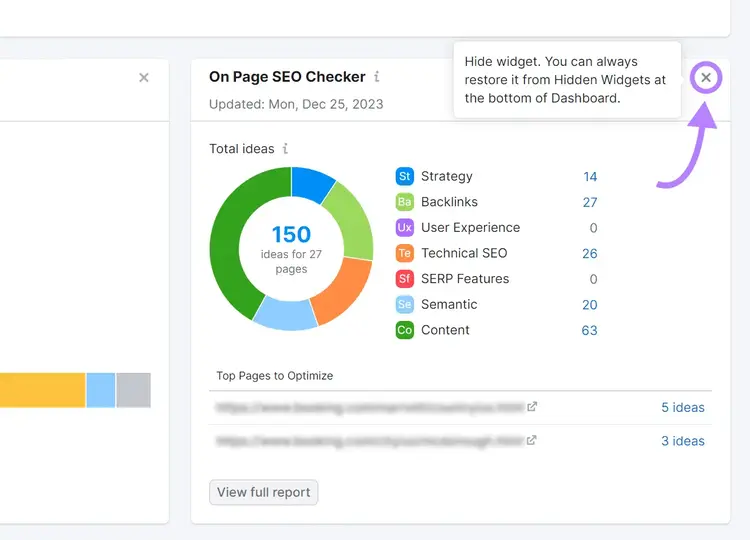
Users can click each part of the dashboard to access more in-depth reports.
Why Use Analytics Dashboards?
Analytics dashboards make it quick and easy to understand real-time business performance in a particular area (e.g., digital marketing).
This means stakeholders can track progress toward goals without having to dig through lots of data. Or ask colleagues for custom reports.
Plus, teams can identify performance issues (and take action) more quickly.
Let’s say two websites experience a sudden traffic drop due to a technical issue:
Website A monitors a website analytics dashboard daily. They quickly notice and investigate the traffic drop. So, they fix the issue before it causes much harm.
Website B only checks traffic metrics at a monthly reporting meeting. They don’t notice and address the traffic drop until four weeks later. After they’ve lost lots of potential sales.
In addition to real-time performance monitoring, analytic dashboards also help with creating in-depth reports.
Reports document performance over a certain time period. They assist with record-keeping and allow more “hands-off” stakeholders to get regular updates.
Plus, there’s scope to go in-depth and include information from other sources (e.g., competitor analysis). That’s why reports beat dashboard analytics for long-term planning.
Tip
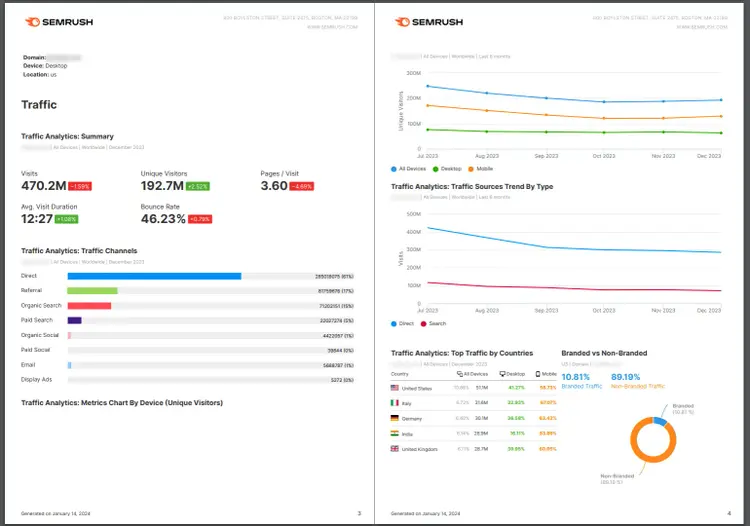
Head to My Reports in Semrush to create automated marketing reports every day, week, or month. You can combine data from Semrush, Google Analytics, Google Search Console, Google Business Profile, and more.
How to Create a Data Analytics Dashboard
Here’s how to create an analytics dashboard, step by step:
1. Define the Dashboard’s Purpose
First, define the purpose of the analytics dashboard.
You’ll need to consider who will use the dashboard and what questions it should answer.
For example, your marketing team might want to create an SEO dashboard that answers:
You’ll need to create an account and install a tracking code on your site.
Other common sources for data analytics dashboards include:
Digital marketing tools like Semrush
Customer relationship management (CRM) tools like HubSpot and Salesforce
Internal databases and spreadsheets
Financial systems like QuickBooks and Xero
Social media platforms like X (formerly Twitter) and LinkedIn
Email marketing platforms like Mailchimp
4. Choose a Dashboard Creation Tool
Next, decide where to create your data analysis dashboard.
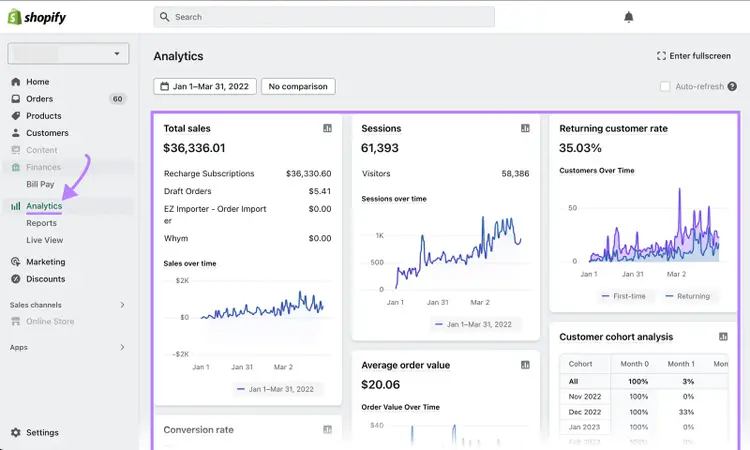
Many analytics platforms (or tools with analytical features) have built-in, customizable dashboards. And some offer integrations that let you import data from elsewhere.
For example, project dashboards in Semrush display data from various tools.
So, make sure to check functionality in the tools you use to collect data. (And take these features into account when you’re next comparing tools.)
Alternatively, use a data visualization platform.
Data visualization platforms allow you to import data from multiple sources. And tend to offer more customizations.
But, if you’re not a data analyst, they can be more difficult to use.
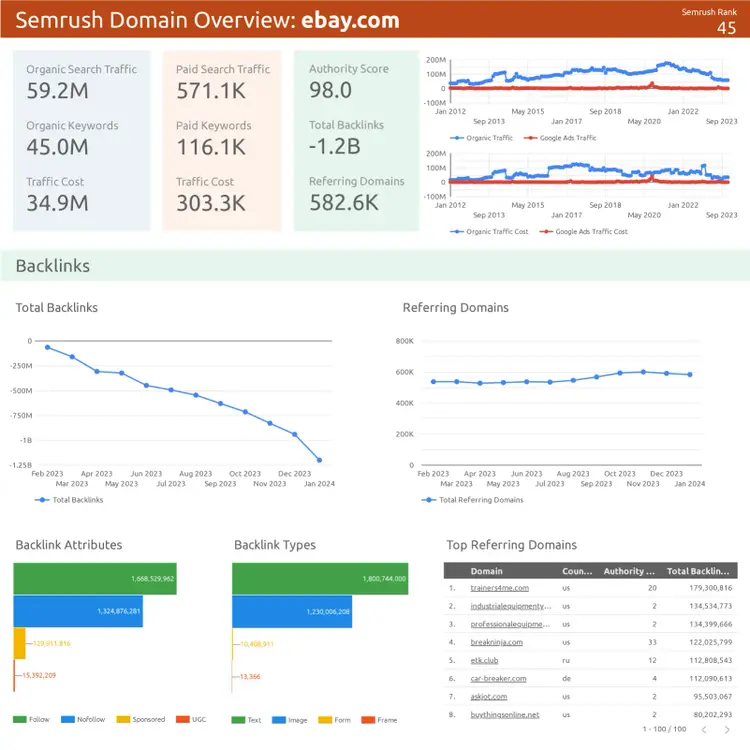
Google Looker Studio is one of the most popular choices. It’s a free tool that lets you import and visualize data from various sources, including Semrush.
Here’s an analytics dashboard example featuring data from Semrush’s Domain Overview tool:
The right platform for your needs depends on the data integrations, customizations, security features, and collaboration options available. In addition to your budget.
5. Design and Share Your Dashboard
You’re now ready to customize or build your analytics dashboard.
Here are some tips to bear in mind, depending on your platform:
Place the most important metrics near the top of the dashboard
Group metrics by type so it’s easier to absorb information
Use the most appropriate visualization for each type of data
Include benchmarks and/or goals to put numbers into context
Include data from a time range that makes sense for your needs (e.g., last 30 days)
When you’re finished, share your analytics dashboard with relevant stakeholders.
And gather feedback over time.
Ask relevant stakeholders to share:
Which metrics they use the most
Which metrics they think are missing
Anything they find hard to use or understand
This will allow you to make iterative improvements to your analytics dashboard.
Analytics Dashboard Examples
If you need inspiration, check out these analytics dashboard examples:
SEO Analytics Dashboard Example
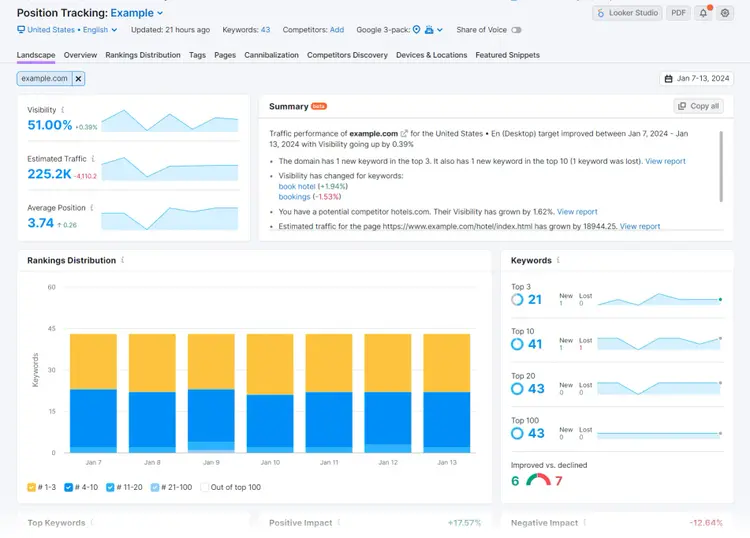
SEO analytics dashboards help users track performance of their SEO strategy. In other words, how visible their business is in organic (unpaid) search engine results. And what benefits this visibility drives.
These dashboards are primarily used by digital marketers.
Here’s an SEO dashboard created in Semrush:
At the top, we get a snapshot of the domain’s organic performance. And how this has changed over the past 30 days.
Underneath are highlights from the Position Tracking tool, which monitors the domain’s Google rankings. The “Visibility” metric makes it easy to understand overall performance over time.
Further down, we’ll find summaries from tools including:
Site Audit, which checks for technical SEO issues on the domain
Not sure which metrics to track? Check out our guide to SEO KPIs.
Web Analytics Dashboard Example
Web analytics dashboards are designed to summarize how users interact with a site. They’re primarily used by digital marketers and user experience (UX) engineers.
By default, it presents data from the last 28 days.
In the upper left, we can see key metrics (users, new users, average engagement time, and total revenue) at a glance. And easily access line charts that show trends over time.
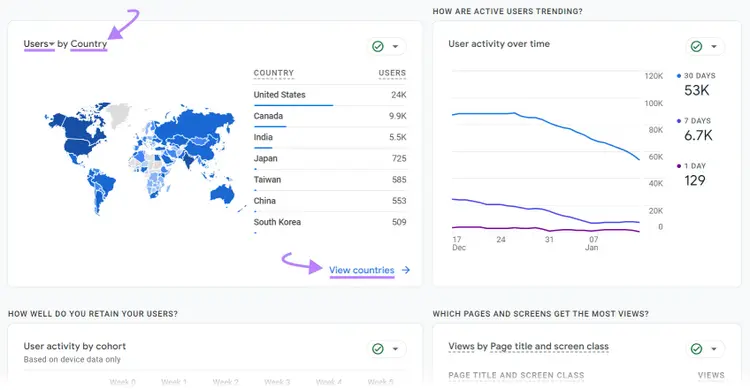
In the upper right, we can see real-time information about the number of users over the past 30 minutes. And which countries they came from.
Further down, there are more charts and graphs.
As with most Google Analytics dashboards, we can customize the data shown. And click through to more in-depth reports.
Not sure which metrics to track in your dashboard? Check out our marketing KPIs guide.
Keyword Rankings Dashboard Example
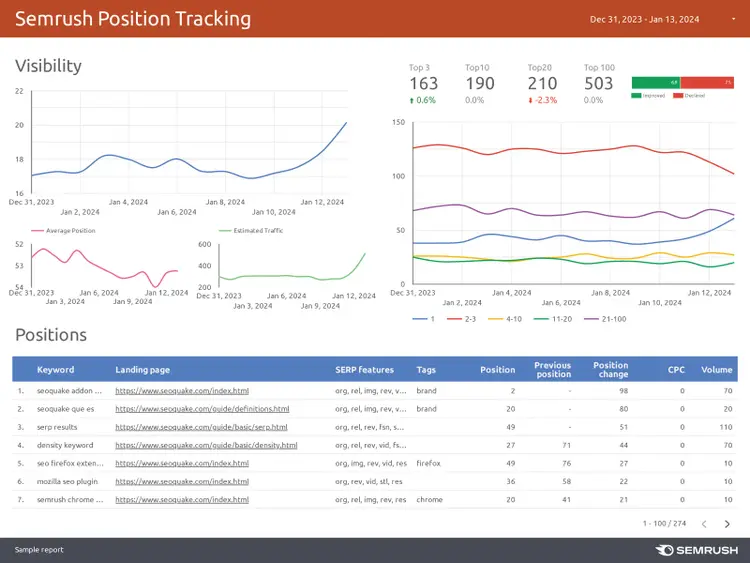
A keyword rankings dashboard is a type of SEO dashboard that focuses on keyword performance. In other words, where the domain ranks for search terms it cares about.
Here’s an example built in Google Looker Studio using Semrush data:
While the line graphs make it easy to understand overall performance, the “Positions” table provides detailed information about target keywords.
Including:
Which page on the domain ranks highest and what position it’s in
What special elements (SERP features) appear on the search engine results page (SERP)
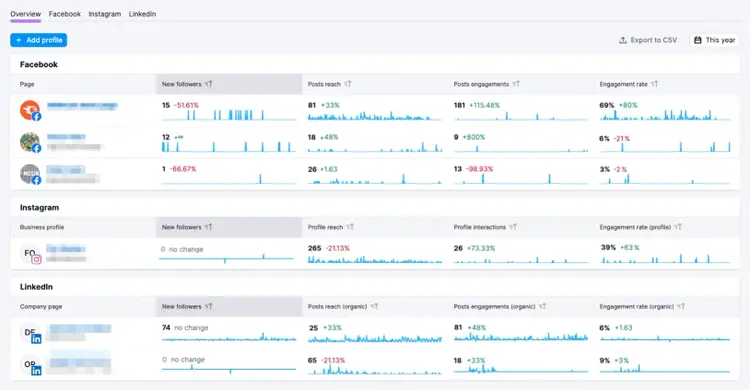
Social media analytics dashboards help users track their performance on platforms like YouTube, Instagram, and LinkedIn. They’re primarily used by social media managers.
Here’s a social analytics dashboard example created with Semrush Social:
At a glance, we can see multiple social accounts are performing. And check for any issues that might require intervention (e.g., a lack of posts in the past few days).
This dashboard streamlines social media management and reporting, because it eliminates the need to check analytics on each platform and account.
Rachel is a Senior Content Writer with 12+ years‘ experience in content marketing and SEO. In a previous role as Head of Content at a digital marketing agency, Rachel developed and executed search-driven content strategies for a diverse range of clients, including global ecommerce brands and local B2B companies. She later transitioned to an in-house role at an SaaS startup, where she focused on scaling content operations and driving organic growth.
Subscribe to learn more about Analytics
Subscribe
By clicking “Subscribe” you agree to Semrush Privacy Policy and consent to Semrush using your contact data for newsletter purposes
Rachel Handley
Rachel is a Senior Content Writer with 12+ years‘ experience in content marketing and SEO. She has worked agency-side, developing and executing content strategies for a wide range of brands, and in-house, driving organic growth for a SaaS startup.
Share
Tells Google to show you more from Semrush in AI, Search, and Discover.