
Having clear key performance indicators (KPIs) simplifies reporting and helps you easily understand how you’re tracking toward your goals.
There are many metrics you could track, so focusing on the ones that are right for your business is essential.
This guide goes over 20 possible KPIs and how you can choose the ones that are most relevant to you.
What are KPIs in marketing?
KPIs in marketing are the metrics that reveal how your business is performing in relation to specific marketing goals.
For example, if you’re aiming to increase online sales, then conversion rate could be a marketing KPI.
Here are some more marketing KPI examples:
- AI visibility
- Keyword rankings
- Click-through rates
- Email open rates
Setting and tracking KPIs helps you understand the impact of your marketing efforts and make more informed decisions.
But before we start going over the actual data points you could use as your KPIs, let's quickly cover the difference between KPIs and metrics.
What is the difference between marketing KPIs and metrics?
The difference between marketing KPIs and metrics is that KPIs are the most important metrics that track progress toward your marketing goals.
Marketing metrics are any measurable data point related to your marketing efforts. They include everything from pageviews and bounce rates to email sends and social media likes. Metrics show what's happening in your campaigns.
Marketing KPIsare specific metrics that directly tie to your marketing goals and indicate whether you're succeeding or failing. They're the numbers that actually matter for your strategy.
For example, if you run an email campaign, you might track dozens of metrics. But your KPIs might only be open rate, click-through rate, and conversion rate — the metrics that determine campaign success.
Now, let’s look at the 20 most important marketing KPIs by category.
AI search KPIs
These AI search KPIs are helpful if you’re focused on improving visibility in platforms like ChatGPT and Google’s AI Overviews.
1. AI visibility
AI visibility measures how often your brand appears in AI-generated answers compared to competitors.
AI platforms are becoming primary sources of information for many users. In fact, over 20% of Americans use AI tools regularly. That means there’s tons of potential to reach prospective customers by appearing in AI responses.
Track your AI visibility with Semrush's AI Visibility Toolkit. The toolkit’s Visibility Overview report provides a visibility score on a scale out of 100. The higher your score, the more dominant your brand's presence is in your niche.
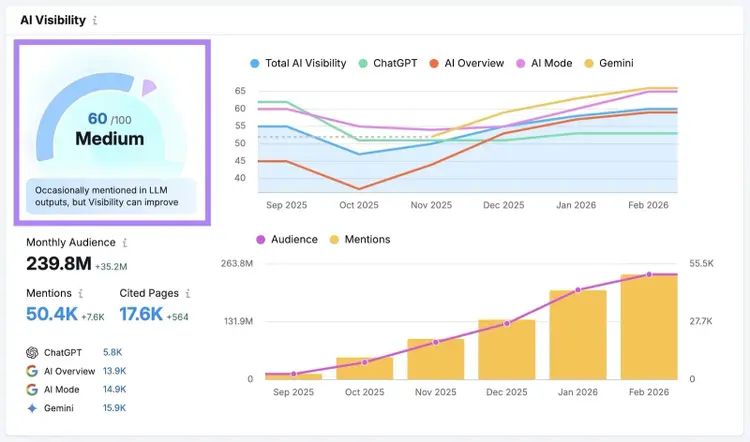
Here are some quick tips for improving your AI visibility:
- Earn brand mentions across the web, especially on high-authority websites that AI platforms trust and reference (e.g., Reddit, Quora, and Reuters)
- Keep your messaging consistent on your website, third-party publications, and social media accounts, so AI systems can accurately represent your brand
- Invest in brand-building activities that strengthen your position in the market, such as PR campaigns, influencer collaborations, and podcast appearances
2. Brand mentions
Brand mentions in AI search are how often your brand name appears in AI platforms’ responses to user queries.
Effectively, brand mentions reveal whether AI systems recognize you as relevant for topics in your industry. And help you understand how much awareness you’re building.
Semrush's Competitor Research report provides detailed brand mention information across platforms like ChatGPT, Google AI Mode, and Gemini.You can see total mentions for you as well as your competitors and identify which topics drive mentions.
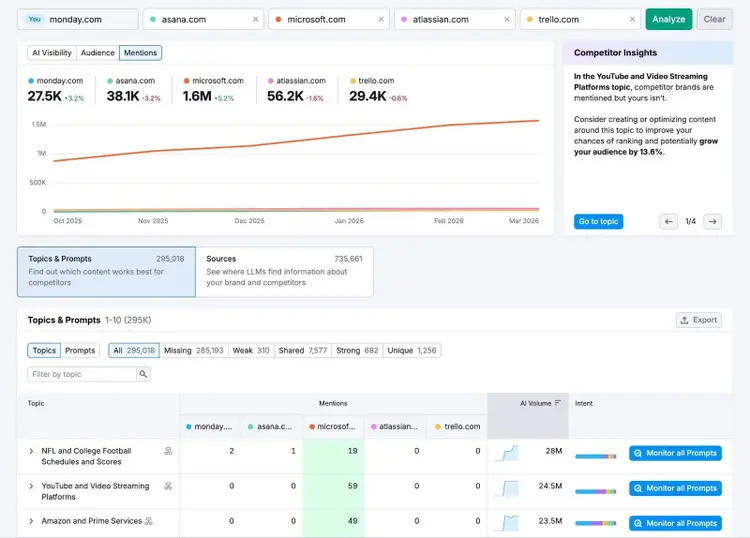
Here are some quick tips for increasing your AI brand mentions:
- Earn brand mentions across high-authority websites, so AI systems associate your brand with trusted sources
- Create content around topics relevant to your industry to position yourself as an expert in your field
- Maintain consistent messaging across your digital footprint to reinforce brand identity and expertise
- Engage in brand-building activities, like publishing research studies and attracting media coverage
3. AI citations
AI citations are linked references to you that AI platforms include in their answers.
If your webpages are frequently cited in AI responses, it’s a good sign that AI systems view your content as credible and authoritative. This builds trust with users and can drive traffic from people who want to explore topics in greater detail.
Visibility Overview shows your AI citations across different platforms.You can see how many of your pages are cited, the specific URLs cited, and the queries that trigger those citations.
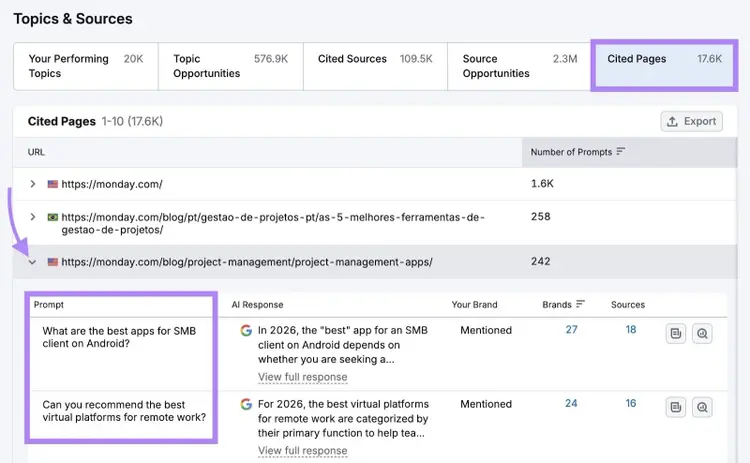
Here are some quick tips for earning more AI citations:
- Structure your content with descriptive subheadings and sections that can stand on their own, so it's easier for AI systems to extract and reference key information
- Publish original research that AI platforms can cite as primary sources
- Create comprehensive guides and resources that directly answer common industry questions
SEO KPIs
Search engine optimization KPIs give you information about how visible your brand is in traditional search results.
To get a holistic understanding of your performance, track SEO KPIs across different query types like:
- Branded queries: Searches that include your brand, product, or service names
- Non-branded commercial queries: Searches that indicate users are researching options to inform a purchase
- Long-tail queries: Highly specific searches
It’s worth keeping in mind that SERP features like AI Overviews have changed how users see and interact with search results. So, your performance across the below SEO KPIs may look different than it used to.
4. Keyword rankings
Keyword rankings are the positions where your pages appear in search engine results for target queries.
The higher you rank for a given keyword, the more likely users are to see and click your result. Especially when you consider that AI Overviews and other SERP features often push down organic results.
You can monitor your keyword rankings in Google Search Console (GSC).The “Performance on Search results” report shows your average position for up to 1,000 queries selected by Google.
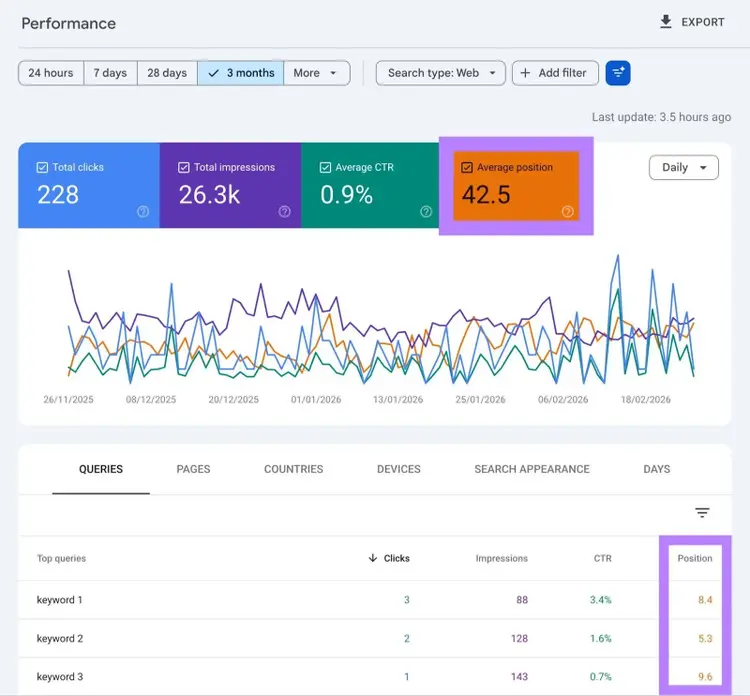
To track a specific set of keywords, compare performance against competitors, and identify opportunities to improve, use Semrush’s Position Tracking tool
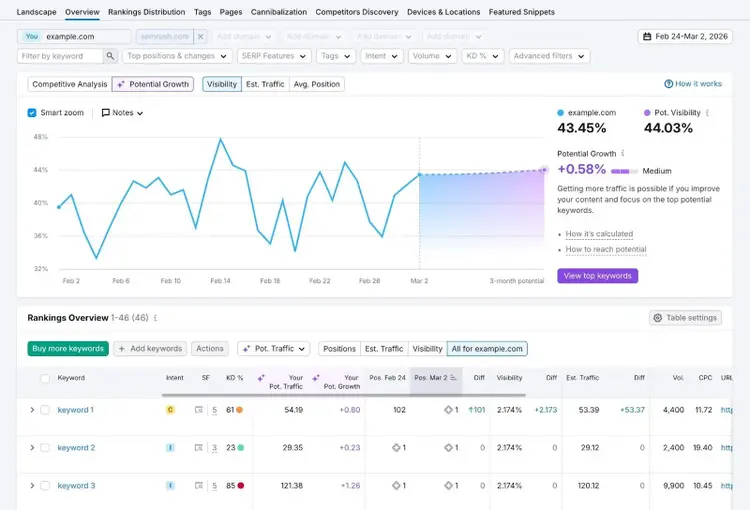
Here are some ways to rank higher on Google:
- Focus on keywords your domain can realistically rank for (e.g., terms that have lower Personal Keyword Difficulty scores in Semrush)
- Analyze and satisfy search intent (what searchers are trying to achieve)
- Implement on-page SEO best practices (e.g., optimizing your title tags and H1s)
5. Organic clicks
Organic clicks are clicks through to your site from unpaid search engine results.
The more clicks you attract from search engines, the more opportunities you have to generate leads and sales.
You can see your organic clicks by keyword, page, and more in GSC.
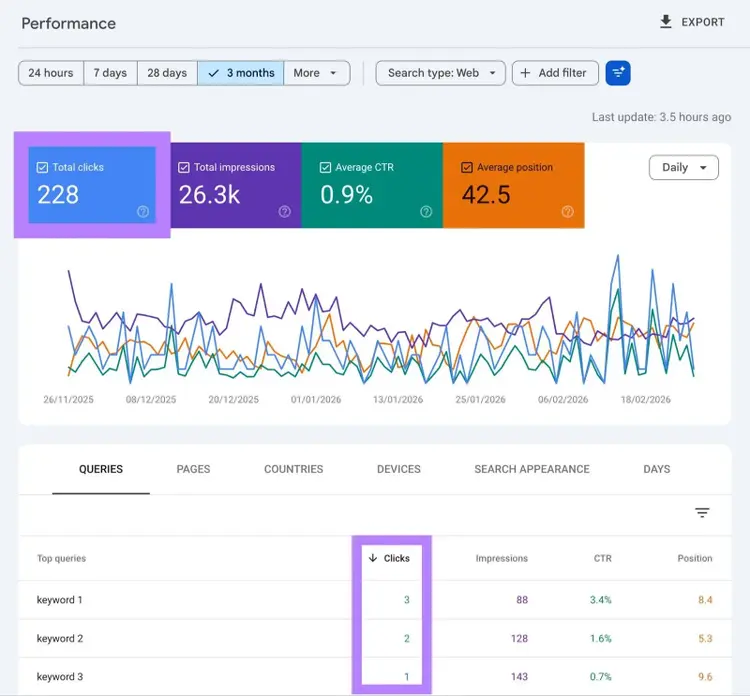
While AI-powered experiences are reducing clicks as a whole, there are still some things you can do to get as many clicks as possible:
- Improve keyword rankings by better aligning with search intent
- Prioritize keywords that are more likely to drive clicks (i.e., avoid zero-click searches)
- Optimize your title tags and meta descriptions to offer clear value that entices users
6. Impressions
Search impressions are how many times your website is displayed to users in search results.
Impressions are a good search marketing KPI because they drive brand awareness and clicks.
You can track Google impressions in GSC.
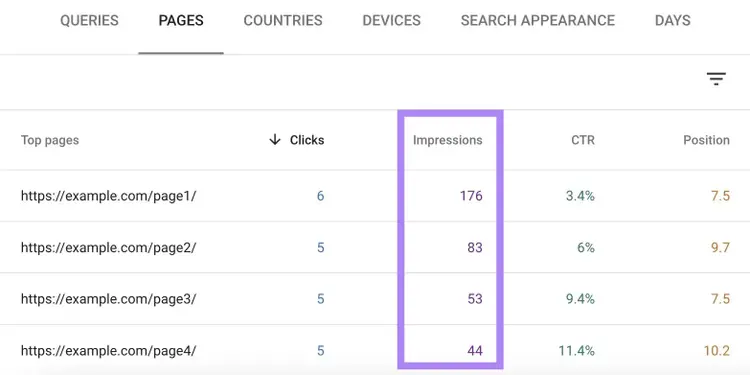
Here are some ways to get more impressions in Google:
- Create content that targets a broader range of relevant search queries
- Improve your keyword rankings
- Optimize for SERP features like AI Overviews and rich snippets by structuring content clearly and using schema markup
7. Backlinks
Quality backlinks from websites that point to your site can improve your SEO performance because they act as endorsements.
Plus, recent evidence suggests that authoritative links strengthen your appearance in AI-generated answers.
Use the backlink tool to monitor your backlinks and related metrics.
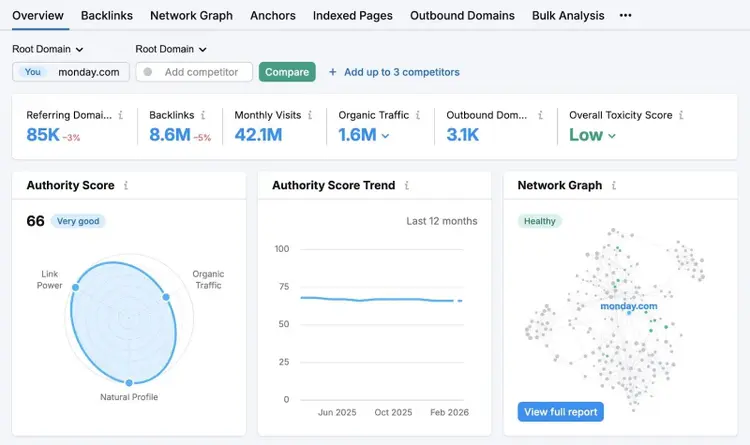
Here are some quick ways to strengthen your backlink profile:
- Create linkable assets like original research, tools, or in-depth guides that naturally attract links
- Reach out to relevant sites to ask for a link — this is most effective if you’re able to suggest a resource the other site’s audience is likely to find useful
- Respond to journalists’ media requests — they often provide a backlink when crediting sources
For more ideas on earning high-quality backlinks, check out our link building guide.
Paid advertising KPIs
Track the below paid advertising metrics to understand whether you’re spending efficiently.
8. Return on ad spend
Return on ad spend (ROAS) tells you how much revenue you generate for every dollar spent on advertising.
An ROAS above 1 indicates that the campaign is profitable, while a ROAS below 1 indicates that the campaign is unprofitable.
Use this formula to calculate ROAS:
ROAS = revenue from ad campaign / total ad spend
When evaluating ROAS, compare it against your profit margins (the percentage of revenue you keep after covering costs) — not just revenue. A campaign can show positive ROAS but still be unprofitable if costs exceed margins.
Read our guides to learn more about tracking your ad spend and maximizing your ROAS on Google Ads.
9. Cost per mille
Cost per mille (CPM) is how much you pay for every 1,000 ad impressions.
CPM helps you estimate how much it’ll cost to reach a specific audience size and evaluate the profitability of brand awareness campaigns.
Many advertising platforms calculate CPM automatically. Here’s what this marketing KPI looks like inside Meta Ads Manager:
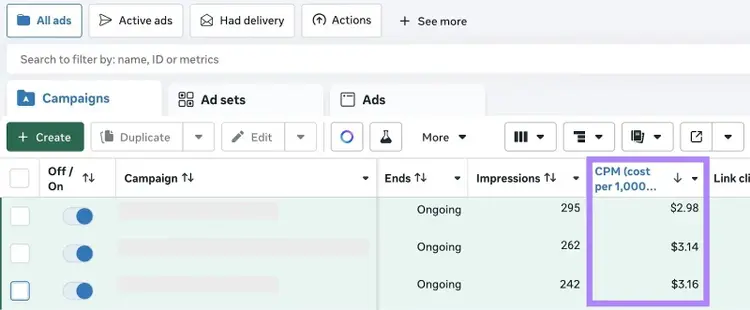
You can also calculate CPM manually with this formula:
CPM = (total campaign cost / total impressions) x 1,000
Here are some ways to lower your CPM:
- Test different ad placements
- Advertise during low-competition times
- Broaden your audience to reduce competition when appropriate
Social media KPIs
Track these social media KPIs to ensure your social media strategy provides meaningful results.
10. Follower count
Follower count is the number of users who follow your social media profile(s) — i.e., the number of people who’ve opted in to see your social media content.
Your follower count matters because the more followers you have, the more likely it is that people will see and engage with your brand’s posts.
You can view follower counts directly on each social media profile.
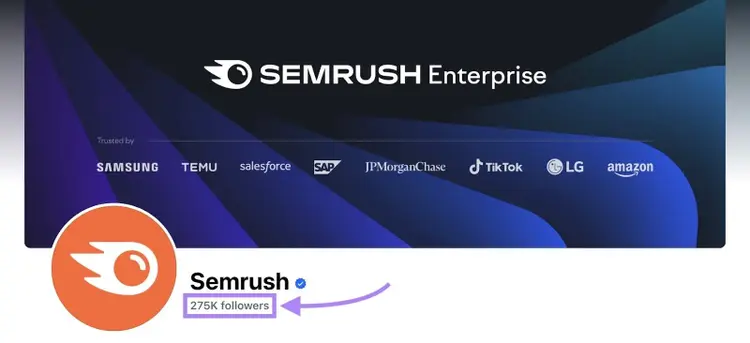
Alternatively, use the Social Tracker tool within Semrush’s Social Toolkit to monitor follower growth across multiple platforms. And compare your performance against competitors’ performance.
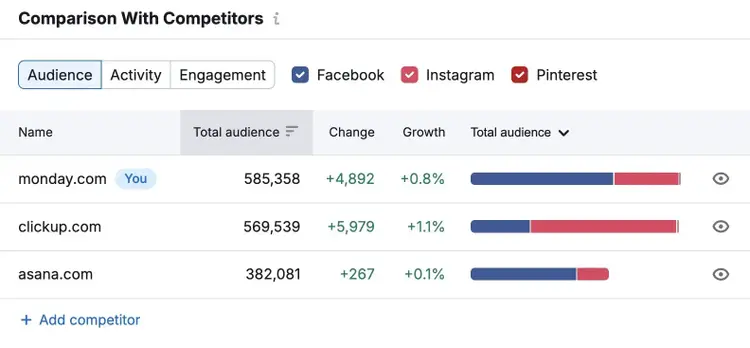
Here are some ways to grow your follower count using the Social Toolkit:
- Maintain a regular posting schedule with Social Poster
- Analyze top-performing posts with Social Content Insights
- Identify the best times to publish with Social Analytics
11. Average engagement rate
Average engagement rate is the percentage of engagements (likes, shares, etc.) on your social media content relative to the number of followers you have.
This KPI indicates how well your social media content resonates with your audience. And the more engaged your audience members are, the more likely they are to amplify and buy from your brand.
Some social media platforms calculate engagement rate automatically in their analytics dashboards. You can also view engagement rate in Semrush’s Social Analytics tool:
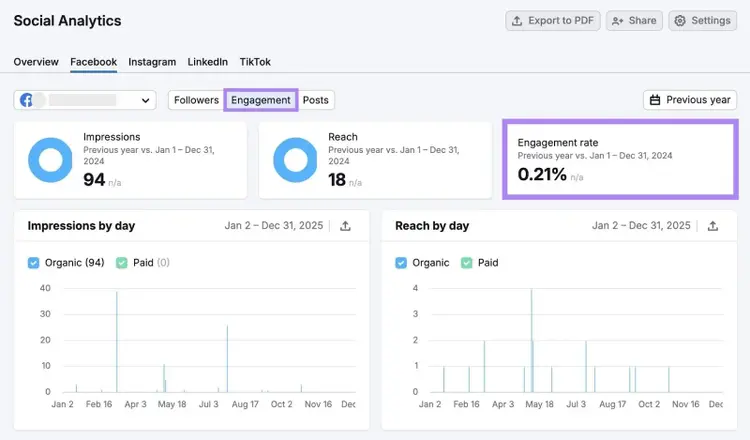
Alternatively, you can calculate your average engagement rate using this formula:
Average engagement rate = ((total engagements / total posts) / total followers) x 100
Here are some ways to improve social engagement:
- Deliver direct value through your posts instead of merely linking elsewhere
- Encourage interaction through questions, polls, or prompts
- Experiment with different content formats and monitor results
Email marketing KPIs
Track these email marketing KPIs to gauge the success of your promotional messages, newsletters, and other email campaigns.
12. Subscribers
Subscribers are users who’ve opted in to receive your marketing emails, so the total number of subscribers reflects the size of the audience you can reach through email campaigns.
You can view subscriber data in your email marketing platform. Here’s what the data looks like in Mailchimp, for example:
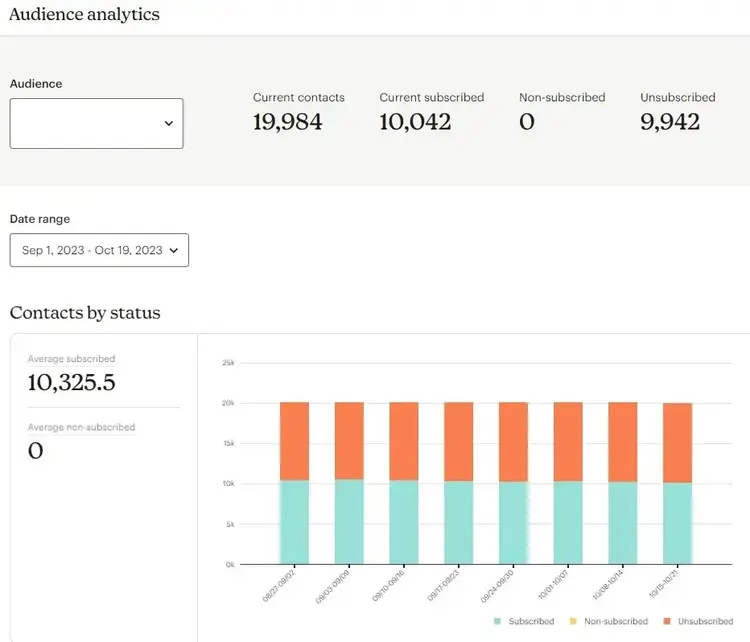
Here are some quick tips for getting more email subscribers:
- Segment your email list to ensure subscribers only receive the emails they’re interested in
- Offer a sign-up incentive (e.g., a welcome discount code)
- Encourage customers to opt in to emails during checkout
13. Open rate
Open rate is the percentage of recipients who open your marketing emails, which helps you gauge the relevance of your email campaigns.
But keep in mind that open rates can be affected by privacy features in some email clients. Which means they’re not always precise.
Most email marketing platforms provide an open rate for each campaign.In Mailchimp, the open rate KPI looks something like this:
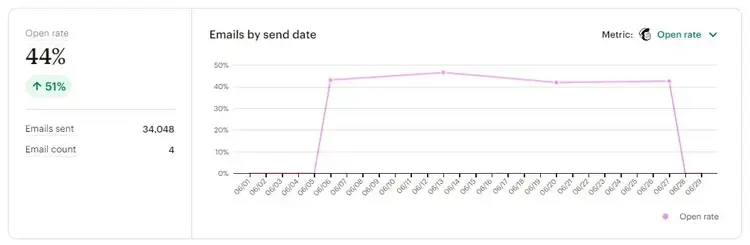
Here are some ways to improve your open rates:
- Write concise and engaging subject lines
- Send tailored emails to specific audience segments
- Optimize your sender name, address, and profile picture
Multi-channel marketing KPIs
These KPIs in digital marketing can help you evaluate efforts across multiple marketing channels.
14. Conversion rate
Conversion rate is the percentage of users who convert (complete a desired action) when viewing a marketing campaign or asset.
A conversion action can be signing up for a newsletter, downloading a resource, or making a purchase. Effectively, it’s any action that conveys interest in knowing more about your brand.
You can measure conversion rates using Google Analytics (GA4).
In GA4, conversions are called key events. Some events are collected automatically, but you’ll need to define which ones count as key events and create any that are missing.
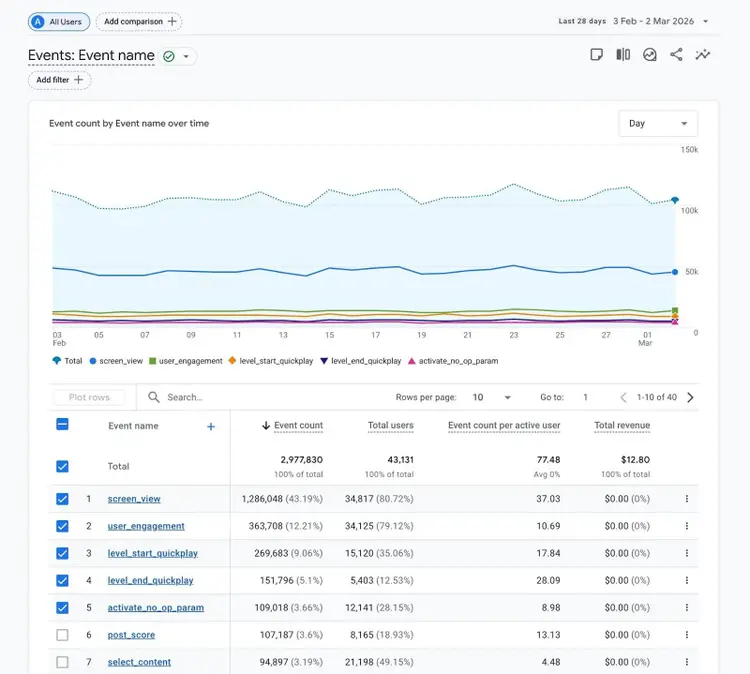
To calculate conversion rate manually, use this formula:
Conversion rate = (conversions / total clicks) x 100
Here are some ways to optimize conversion rates:
- Create dedicated landing pages to promote specific actions
- Use split testing to compare results from different campaign versions
- Clearly communicate what you want users to do — and what’s in it for them
15. Click-through rate
Click-through rate (CTR) is the percentage of users who click through to your website after seeing an ad or campaign.
CTR measures how effectively you attract people to your site through search engine results, digital advertisements, marketing emails, social media posts, and more. And rates across these channels can differ.
For example, display ads often have a low CTR given they appear in places where users are casually browsing. But CTR for search ads may be higher because users are actively searching for solutions.
Many analytics tools automatically calculate CTR. For example, here’s a report from Google Ads:

Use this formula if your platform doesn’t calculate it automatically:
CTR = (clicks / impressions) x 100
Here are some suggestions for improving your CTRs:
- Write clear, compelling calls to action (CTAs)
- Refine audience targeting
- Make CTAs more prominent on pages
16. Customer lifetime value
Customer lifetime value (CLV or CLTV) is the total revenue you can earn from a customer over the course of their relationship with your brand.
To stay profitable, your CLV needs to be higher than your customer acquisition cost (CAC) — how much it costs to acquire a new customer.
You can calculate CLV with this formula:
CLV = average transaction value x average number of transactions per year x average customer retention in years
Here are some ways to increase CLV:
- Implement a customer loyalty or rewards program
- Collect feedback from customers who cancel
- Create tailored campaigns for existing customers
17. Cost per acquisition
Cost per acquisition (CPA) is the average spend it takes to acquire a paying customer.
To stay profitable, your CPA needs to be lower than your CLV.
Use this formula to calculate the CPA:
CPA = total campaign spend / number of customers acquired
Here are some tips for reducing CPA:
- Discontinue, pause, or improve underperforming campaigns
- Refine targeting to reach higher-intent audiences
- Retarget and nurture existing leads
18. Return on marketing investment
Return on marketing investment (ROMI) is how much money your marketing generates relative to what you spend on it.
A positive ROMI indicates that your marketing efforts are contributing to your company’s bottom line.
Use this formula to calculate ROMI for a campaign or channel:
ROMI = ((gross profit - marketing cost) / marketing cost) x 100
Here are the main ways to improve ROMI:
- Cut unnecessary marketing costs (e.g., pause campaigns that don’t drive results)
- Increase revenue generated from existing successful campaigns (e.g., make more engaging ads)
19. Leads
Leads are potential customers who’ve demonstrated interest in your product or service — for example, by filling out a form or adding a product to their cart.
There are two main types of leads:
- Marketing qualified leads (MQLs): Prospects who engage with marketing activities like downloading an ebook or clicking an ad
- Sales qualified leads (SQLs): Prospects who show clear purchase intent (by booking a demo, for example) and are ready to talk to the sales team
Tracking MQLs and SQLs separately helps you assess lead quality and quantity.
You can track your total number of leads and their statuses in a customer relationship management (CRM) platform like HubSpot or Salesforce.
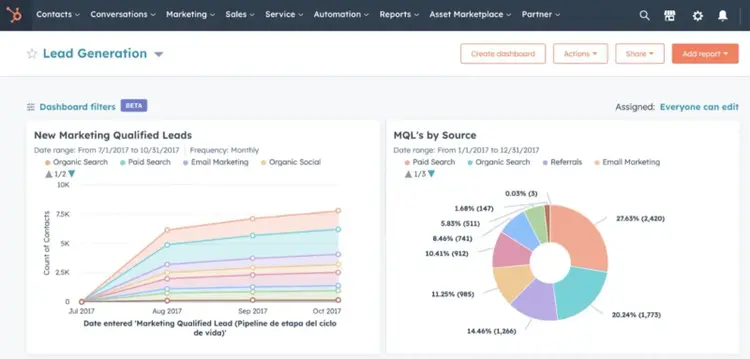
Here are some ways to improve lead generation:
- Create high-quality gated content that users can only access by submitting their information
- Optimize your landing pages and forms
- Use retargeting ads to re-engage visitors who leave your website without converting
20. Cost per lead
Cost per lead (CPL) is how much you spend to generate a single lead from your marketing efforts.
Tracking CPL helps you to identify inefficiencies in your marketing strategy, so you can adjust to maintain profitability.
Use this formula to calculate CPL:
CPL = total marketing campaign cost / number of leads generated
Here are some ways to reduce your CPL:
- Leverage organic channels like SEO, AI search, and social media
- Invest more in campaigns that deliver low CPL
- Pause or optimize your high-CPL activities
How to choose the right KPIs for your campaign
Choose KPIs that directly measure against your marketing campaign’s primary objective and connect to larger business outcomes.
Start by determining which KPIs matter for your campaign objective. Here’s a look at some overarching campaign goals and some KPIs you may want to track for each:
- Brand awareness campaigns: Track reach, impressions, video views, or brand search volume
- Lead generation campaigns: Focus on leads, CPL, and conversion rate
- Revenue-focused campaigns: Prioritize ROAS, CPA, and conversion rate
Limit your focus to three to five primary KPIs per campaign. Tracking too many metrics dilutes focus and makes it harder to identify what drives results.
And be sure to set clear targets. So your KPIs clearly indicate whether you’re on track.
Start tracking your marketing KPIs
Tracking your KPIs consistently is easiest when you have one dashboard that:
- Emphasizes your most important metrics
- Shows performance against targets or previous periods
- Highlights trends over time
- Segments data by channel or campaign when needed
Semrush's My Reports tool lets you combine data from multiple marketing channels into a single dashboard.
Instead of switching between platforms to check website analytics, social media metrics, AI search performance, and paid ad results, you can pull everything together in one place.
Just go to My Reports to select a template. Or, start creating your own dashboard from scratch.
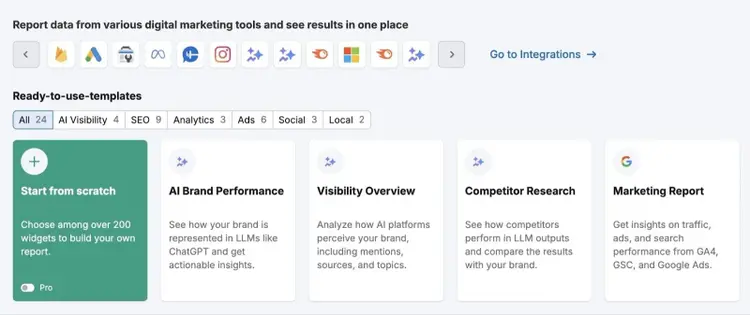
Maintaining one dashboard with all your KPIs also makes it easier to share insights with your team or stakeholders.
Sign up to get started today.
Create Your First Dashboard
with a Free Semrush Account

Vlado is a content marketer with 10+ years of experience in SEO, content strategy, and building websites for both clients and personal projects. As Content Operations Lead at Semrush, he streamlines workflows and optimizes processes. He also played a key role in scaling content production and shaping the blog Style Guide. Previously, as Head of Content at Mangools, he led initiatives that made the blog a major driver of organic traffic. He enjoys making complex SEO topics accessible to others.
Vlado Pavlik
Vlado is a content marketer with 10+ years of experience in SEO, content strategy, and website building. As Content Operations Lead at Semrush, he focuses on improving content workflows, optimizing processes, and helping scale content production.
Tells Google to show you more from Semrush in AI, Search, and Discover.