
What Are Website Metrics?
Website metrics are data points that let you evaluate your website’s performance. And are often about how people find, use, and interact with your site.
Think of them as signals that answer questions like:
- Are people finding my website?
- Are they sticking around?
- Are they doing what I hoped they would do?
Let’s dive into the metrics themselves.
1. Total Visits
The total number of visits is how many times people have landed on your site during a specific time frame—such as a week, month, or year.
Tracking this metric over time helps you understand whether your website audience is growing and how your traffic trends evolve.
How to Track It
This metric can be found in website analytics tools like Google Analytics (GA4).
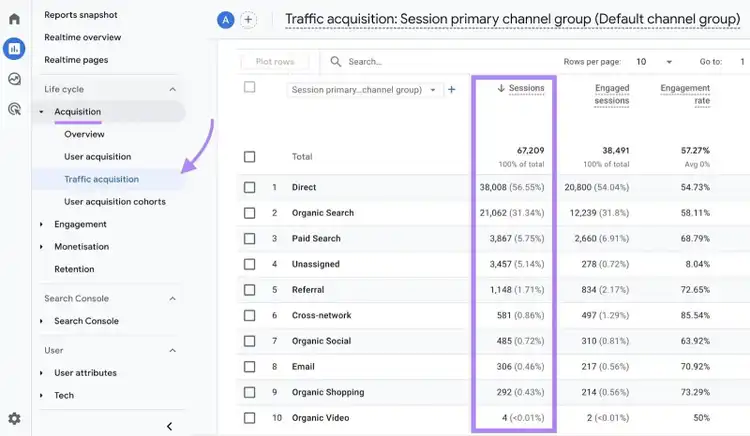
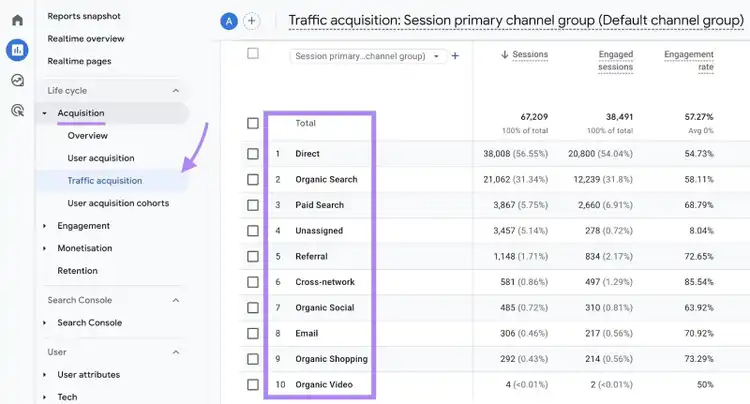
To find it (“sessions,” specifically), go to “Acquisition” > “Traffic acquisition” and look for the “Sessions” column to see the total number of sessions from each traffic source over your selected date range.
For a quick look at your traffic that doesn’t require setup, use Semrush’s Free Website Traffic Checker. Or even use it to check competitors’ website traffic.
How to Improve It
You can grow your website traffic in multiple ways, such as improving search engine optimization (SEO), creating an effective social media strategy, or investing in paid advertising.
But keep in mind that not all traffic is equally valuable.
As Eric Doty, Content Lead at Dock, puts it:
Not all traffic is created equal. At Dock, we focus on a hand-curated list of key product and blog pages—those that actually matter to our business. Total site traffic can be noisy and misleading.
A smaller, more interested group is often worth more than a larger crowd that leaves your site right away.
2. Unique Visitors
Unique visitors are the total number of individual people who visit your site during a specific time period. And helps you understand your true audience size.
Because even if someone visits five times, they still count as just one unique visitor. More unique visitors usually means your marketing efforts are reaching new people.
How to Track It
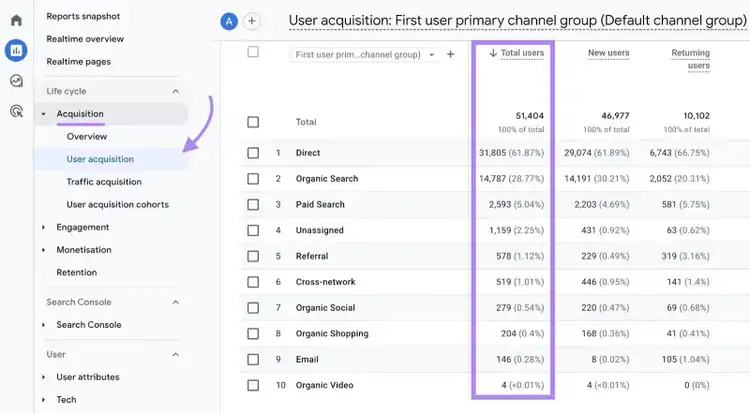
In GA4, find this metric (called “total users”) by going to “Reports” > “Acquisition” > “User acquisition.”
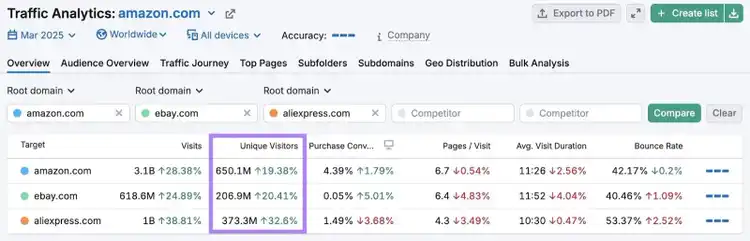
You can also view your and your competitors’ estimated unique visitors using Semrush’s Traffic Analytics tool (the “Unique Visitors” metric).
Analyze Competitors’ Traffic
with the Traffic Analytics Tool
How to Improve It
To get more unique visitors, focus on reaching new people. Which you can do by:
- Covering new topics: Create content around topics you haven’t covered yet to reach different types of searchers
- Promoting your content in the right places: Share content where your audience already hangs out, like social media or online communities (as long as you’re a genuine participant)
- Collaborating with others: Work with influencers or partners who can introduce your brand to their audiences
3. Returning Users
Returning users are people who’ve visited your site before and come back during a specific time period.
This metric shows how well your site holds people’s interest. If they return, it likely means they found something useful or valuable.
As Kevin Indig, Growth Advisor and former Director of SEO at Shopify, puts it:
Total visits show that your content is discoverable. But returning visitors are what tell you you’re building real trust. If people keep coming back, you’re not just getting attention—you’re building an audience.
How to Track It
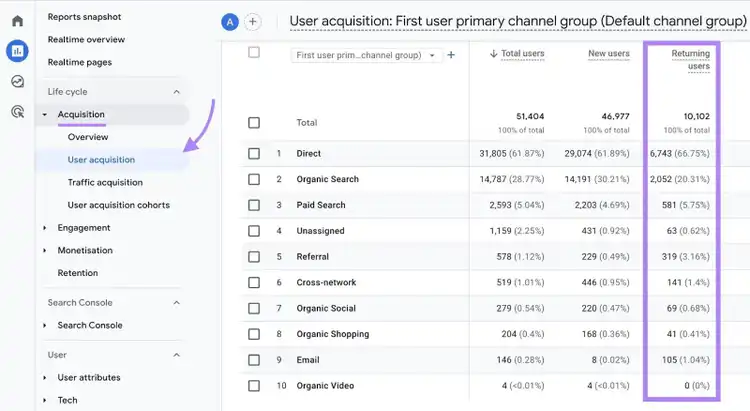
In GA4, go to “Reports” > “Acquisition”> “User acquisition” to view the “returning users” metric.
How to Improve It
To increase your returning visitors, focus on regularly publishing high-quality content that’s useful, well-researched, and tailored to your audience.
4. Traffic Sources
Traffic sources reveal where your visitors are coming from. When you know which channels bring in the most visitors, you can focus on what’s working and rethink what isn’t.
For example, if most of your traffic is organic traffic(meaning traffic that comes from unpaid search results), it’s worth investing more in SEO.
As Ray Berry, Founder of dslx, puts it:
Understanding where our traffic comes from is critical. We’re no longer just seeing entries from Google. ChatGPT and other AI tools are becoming major sources. If our reporting tools can’t give us that insight, we make a point to ask new customers directly about how they found us.
Common traffic sources include:
- Organic search: Visitors who found your site through unpaid search engine results
- Direct: People who typed your URL directly into their browser bar or used a bookmark
- Referral: Visitors who clicked a link on another website or platform (e.g., a news article)
- Social: Traffic from platforms like Instagram, LinkedIn, X (formerly Twitter), or Facebook
- Email: Visitors who clicked a link in a newsletter or marketing email
- Paid search: Users who came through paid ads in search engines
How to Track It
In GA4, go to “Reports” > “Acquisition” > “Traffic acquisition” to see your traffic sources.
It shows which traffic sources are bringing users to your site and other GA4 metrics.
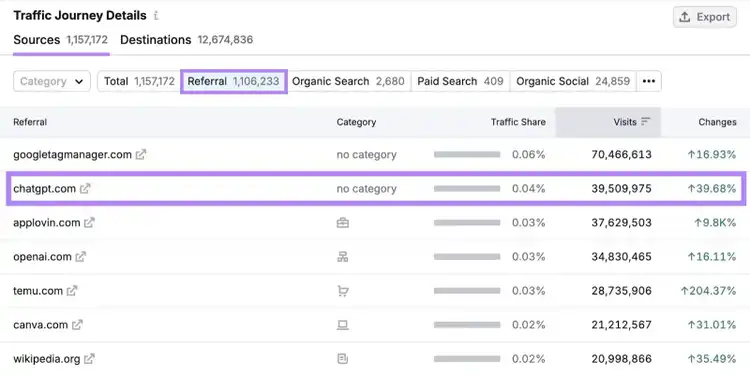
Spot newer traffic sources, like ChatGPT or other AI tools, using Traffic Analytics.
Just enter your domain, go to the "Traffic Journey" tab, select "Referral" at the top, and scroll down to the “Traffic Sources Details” table at the bottom to see if tools like ChatGPT are sending visitors.
5. Views per Active User
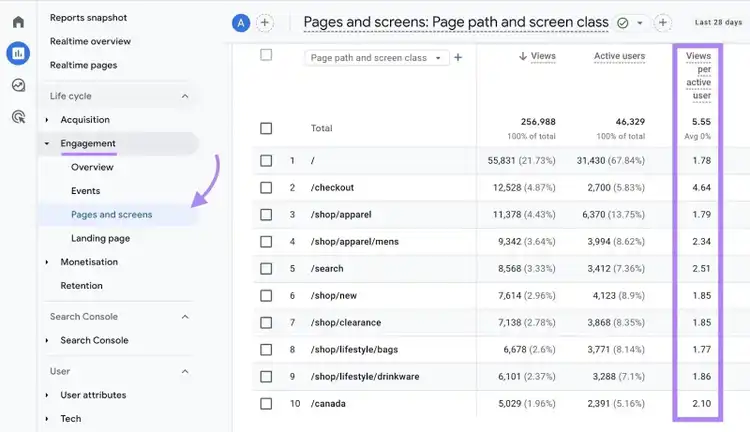
Views per active user is a metric that shows the average number of pages viewed by an active user on your site within a specific time range.
This metric gives you a sense of how engaging your site is.
A higher number suggests people are exploring multiple pages. Which is often a sign that your content is useful, relevant, and/or easy to navigate.
How to Track It
In GA4, find this metric by going to “Reports” > “Engagement” > “Pages and screens.”
How to Improve It
To encourage users to view more pages during their visits you can:
- Add links from different pages on your site to others (called internal links)
- Use simple and intuitive navigation menus, so visitors can easily find what they’re looking for
- Structure your blog articles clearly with headlines, short paragraphs, and logical flow, so they’re easy to scan and encourage visitors to keep reading
6. Average Engagement Time
Average engagement time shows the average amount of time users spend actively on your website (meaning your website was the focus).
This metric helps you understand how interested your visitors are in what they’re seeing. If people are spending more time on your site, it likely means they’re reading, scrolling, or taking other actions.
It’s calculated like this:
Average engagement time = total time your site was in focus / total number of active users
For example, if users spent a total of 4,000 minutes actively engaging with your site over a week, and you had 2,000 active users, your average engagement time for the week would be two minutes (4,000 / 2,000).
How to Track It
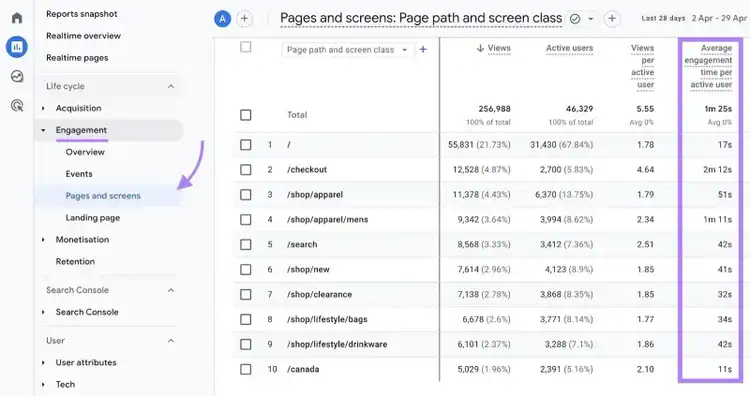
To find this metric in GA4, go to “Reports” > “Engagement” > “Pages and screens.” You’ll see the “average engagement time per active user” for your whole site as well as individual pages.
How to Improve It
What counts as good engagement time depends on the page type and your audience.
That said, here are a few ways to improve it:
- Improve content quality: Make sure your content is useful, clear, and targeted to your audience
- Improve page structure: Use clear headings, short paragraphs, and bullet points to make your content easier to scan and read
- Include visuals: Images, videos, and charts can hold attention and break up long blocks of text
- Match content to intent: If someone lands on your page from a paid ad or search result, make sure it delivers what the headline promised (known as matching search intent)
7. Engagement Rate
Engagement rate shows the percentage of engaged sessions in GA4.
A session is considered engaged if it meets any of these criteria:
- Lasts 10 or more seconds
- Includes two or more pageviews or screen views
- Triggers a conversion event (like clicking a button or watching a video)
Here’s the formula:
Engagement rate = (engaged sessions / total sessions) × 100
How to Track It
In GA4, go to the “Traffic acquisition” report under the “Life cycle” > “Acquisition” section.
Look for the "engagement rate" column to see how your traffic sources are performing in terms of user engagement.
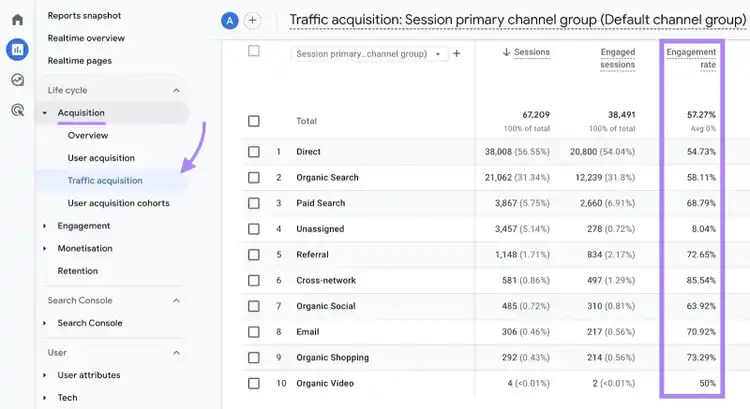
Check out this guide to GA4 engagement rate for instructions on customizing your reports and interpreting your data.
How to Improve It
What counts as a good engagement rate depends on your industry, audience, and content type.
But one thing holds true across the board:
People engage with content that’s genuinely helpful.
As Sean Collins, SEO Content Manager at Scoro, puts it:
If you want people to stick around, you need to create content that actually helps them. Engagement isn’t about tricking users into staying longer—it’s about giving them what they came for.
With that in mind, here are a few ways to increase your engagement rate:
- Match your content to user intent: Matching your content to a visitor’s search intent gives you a better chance of keeping their attention
- Check your mobile experience: Mobile users are more likely to leave if your layout is clunky, buttons are too small, or pages take a long time to load. Follow mobile best practices and test across devices.
- Use heatmaps and session recordings: Tools like Hotjar and Microsoft Clarity can show you where people are clicking, scrolling, and dropping off. To help you make data-backed user experience (UX) improvements that keep users engaged.
8. Conversion Rate
Conversion rate measures the percentage of visitors who completed a desired action on your site. Such as signing up for a newsletter, submitting a form, downloading a guide, or making a purchase.
What counts as a conversion depends on your goals.
For example, if your goal is lead generation, a form submission might be your primary conversion event. If you run an ecommerce site, it's likely a completed purchase.
Whatever you’re measuring, the conversion rate formula is:
Conversion rate = (number of conversions / number of visitors) × 100
How to Track It
The easiest way to track your website’s conversion rate is by setting up conversion events in GA4.
To do this, you’ll need to:
- Identify what actions count as conversions
- Set those actions as conversion events (these are called “key events” in GA4)
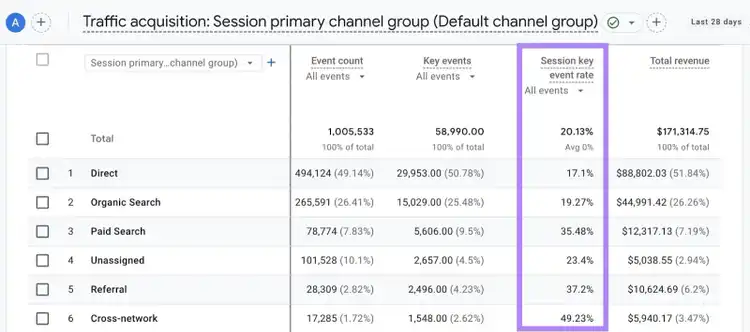
- Customize your reports to include either the session key event rate or the user key event rate
Once set up, view your conversion rate in the “Traffic acquisition” report, where it appears as “Session key event rate.”
How to Improve It
Here are a few ways to optimize your conversion rates:
- Streamline the user journey: Remove extra steps or form fields to reduce friction. Especially in ecommerce checkout and sign-up flows.
- Improve your website design: Use A/B tests to experiment with layouts, headlines, calls to action (CTAs), and more
- Build trust: Add testimonials, reviews, trust badges, or guarantees to reassure users
9. Cost Per Conversion
Cost per conversion (CPC) is most commonly used in paid advertising to measure the average cost of getting one person to complete a specific action. Such as filling out a form, signing up, or making a purchase.
It’s a key metric for understanding whether your marketing efforts are cost-effective.
Here’s the formula:
Cost per conversion = total campaign cost / number of conversions
So, if you spend $10,000 on a campaign (including social media ads and creative), and 50,000 users complete your desired action (like submitting a form), your cost per conversion would be 20 cents (10,000 / 50,000).
How to Track It
Most ad platforms automatically calculate cost per conversion once conversion tracking is set up.
Here's how it works across popular platforms:
- Google Ads: You can track cost per conversion (called cost per action in Google Ads) in your reports. Just make sure your conversion actions are set up correctly and that you’ve added the “Cost / conv.” column.
- Meta Ads (Facebook/Instagram): Meta Ads reports “cost per result” based on your selected campaign objective
- LinkedIn Ads: In LinkedIn Campaign Manager, you can view cost per conversion by enabling conversion tracking and adding the correct column to your campaign performance reports
How to Improve It
If your cost per conversion is higher than you'd like, here are a couple of ways to lower it:
- Refine your targeting: Use performance data to identify which audience segments are converting best. And adjust your targeting settings to focus on those demographics, interests, or behaviors.
- Make sure your ad and page match: If your ad promises one thing but the landing page delivers something else, people often drop off. Keep the message, offer, and design consistent from ad to page.
10. Keyword Rankings
Keyword rankings show the specific positions where your webpages appear in search engine results pages (SERP) for specific keywords your audience is searching.
For example, if someone searches “best yoga mats” and your website appears in the third position on Google, your keyword ranking for that term is position 3.
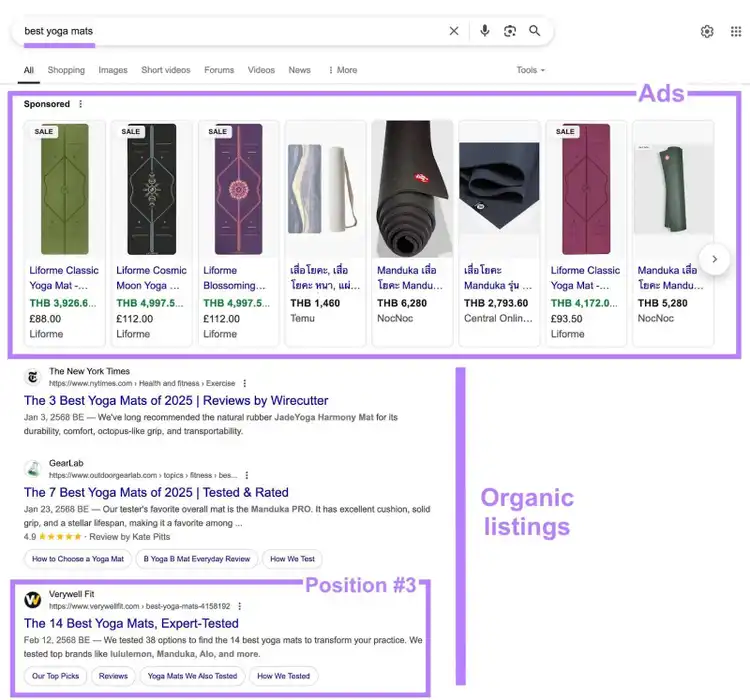
Ideally, aim to rank in positions 1-3 for as many relevant keywords as possible. These spots get the most attention.
How to Track It
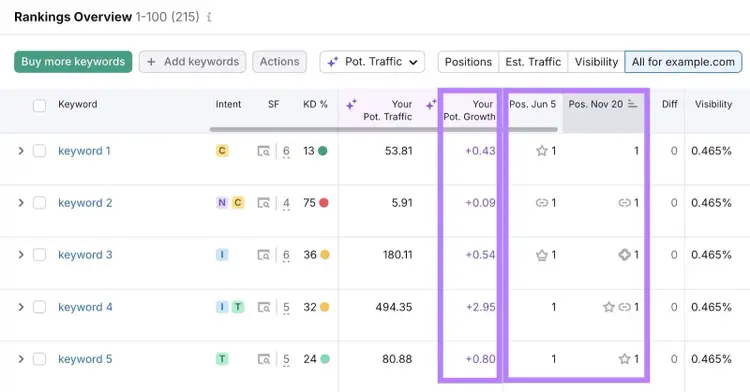
You can track your keyword rankings using Semrush’s Position Tracking tool. And even get an AI-powered estimate of your ranking potential
Track Your Rankings
with the Position Tracking Tool
How to Improve It
Start with these proven tips to rank higher:
- Target the right keywords: Use a keyword tool to find search terms that people are actually using, aren’t too competitive, and make sense for your business
- Make sure content matches search intent: Google prioritizes pages that give searchers what they want. Before you write, look at what type of content shows up—and create something in a similar format.
- Use your keywords naturally: Include your primary and secondary keywords naturally throughout your page in key places like the title tag, first paragraph, headings, and meta description. But don’t overdo it.
11. Backlinks
Backlinking is when other websites link to your site. These links act like votes of confidence and are a strong signal to search engines that your site offers quality content people can trust.
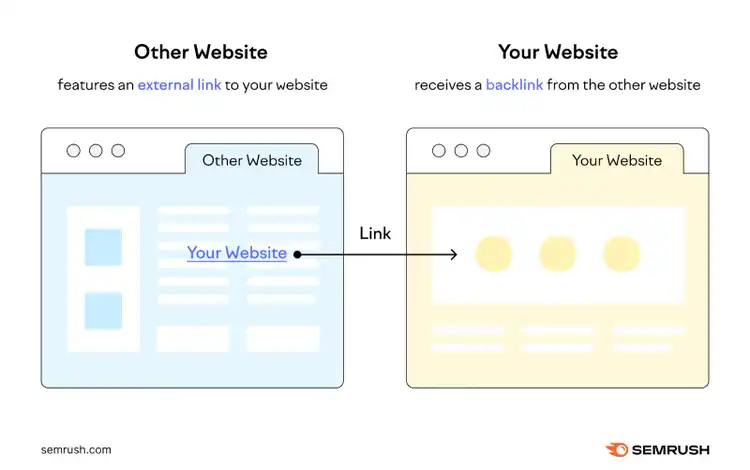
The more high-quality and relevant backlinks you have, the more credible your site looks in the eyes of search engines. Which can help improve your keyword rankings and drive more organic traffic.
How to Track Them
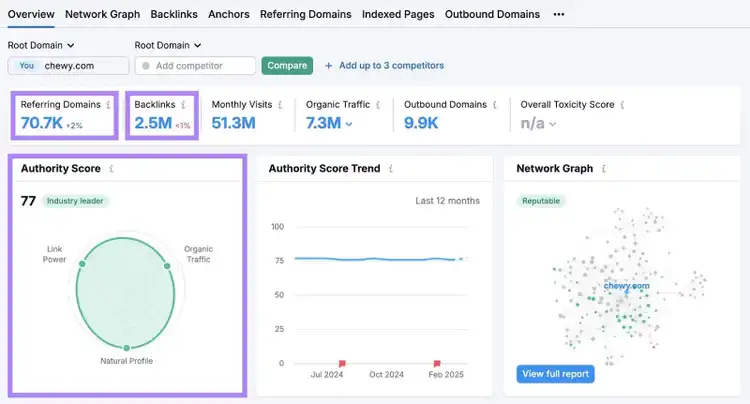
Use the Backlink Checker to see who's linking to your site and how strong those links are.
Just enter your domain to get a snapshot of your total number of backlinks. And how many referring domains (sites that link to your site) you have.
How to Get More Backlinks
Getting more high-quality backlinks takes time. But these techniques help:
- Find and fix broken backlinks: Broken link building involves finding dead links on other websites and offering a working link to your own relevant content as a replacement
- Look for unlinked mentions: Use a brand monitoring tool to find places where your business is mentioned without a link. Then, politely ask the author to add one.
- Leverage digital PR: Use digital PR to pitch original data, expert insights, or unique stories to journalists and online publications. If they feature you, they may include a link.
Further reading: 10 Link Building Strategies That Work
12. Click-Through Rate
Click-through rate (CTR) shows the percentage of people who clicked your link after seeing it. It’s a simple way to measure how well your title or listing grabs attention in search results or ads.
Here’s the formula:
Click-through rate = (number of clicks / number of impressions) x 100
Let’s say 10,000 people searched for “strawberry cheesecake recipe,” and your result appeared in Google like this:

If your result was viewed 10,000 times and clicked 1,000 times, your CTR would be 10%.
How to Track It
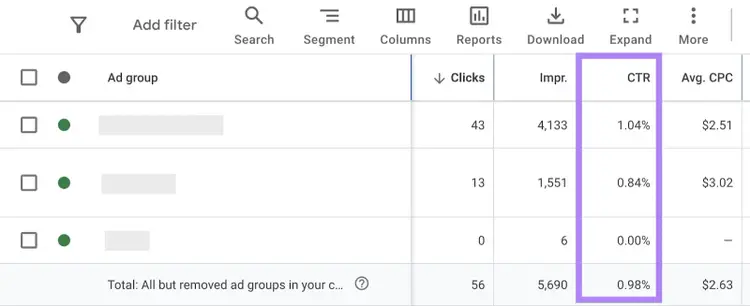
Track CTR in tools like Google Search Console for organic search and Google Ads for paid campaigns. Most reports include a column labeled “CTR.”
For example, you might see a table similar to this in Google Ads:
How to Improve It
A higher CTR often comes down to making your listing more relevant and appealing.
To do this, you can:
- Write clear, helpful page titles and ad copy that matches what people are searching for
- Use engaging meta descriptions that highlight value or benefits (for SEO content)
- Try different formats in your copy (like numbers, questions, or emotional words) to see what gets more clicks
13. Page Load Speed
Page load speed is how long it takes for your webpage to fully appear in someone’s browser.
A fast-loading site is crucial for good UX and SEO performance.
Google has even stated that slow-loading pages can negatively impact your search rankings because they often lead to higher bounce rates and lower engagement.
How to Check It
Check the loading speed of all individual pages using Google’s PageSpeed Insights tool or run our free website SEO checker for a quick speed test.
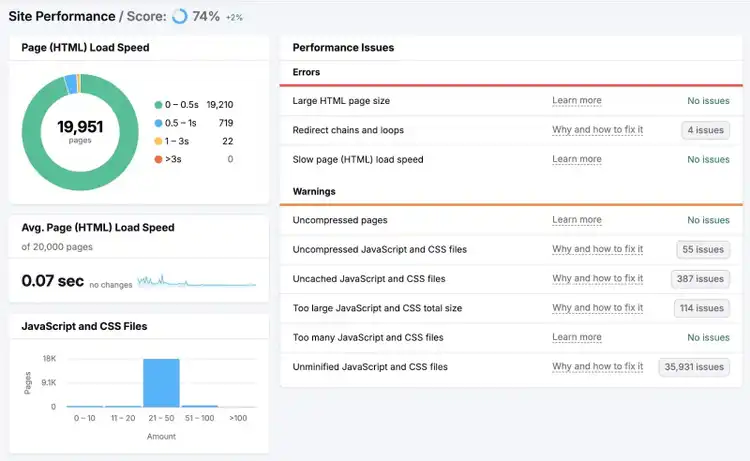
For a more comprehensive view of your site's speed and overall performance, use Semrush Site Audit.
In the “Site Performance” report, you’ll see a breakdown of page speed across your site, average load time, and suggestions for how to improve any slow-loading pages.
How to Improve It
Improving page speed often comes down to reducing how much your site needs to load.
Here are a few common fixes:
- Compress images: Optimize images with tools like TinyPNG or opt for a more modern WebP format to reduce file sizes
- Use a content delivery network (CDN): A CDN stores copies of your site on servers around the world, so users load it from the server closest to them. This speeds things up, especially for international visitors.
- Minimize code: Remove unused or unnecessary code in your HTML, CSS, and JavaScript files to reduce load times
14. Crawlability
Crawlability is about how easily search engines like Google can find and access the pages on your website.
Search engines use automated bots to scan your site. This process is called crawling.
If a page can’t be crawled, it won’t appear in search results at all. Because crawling is a prerequisite to both indexing (getting your content stored in a database of eligible results) and ranking.
How to Track It
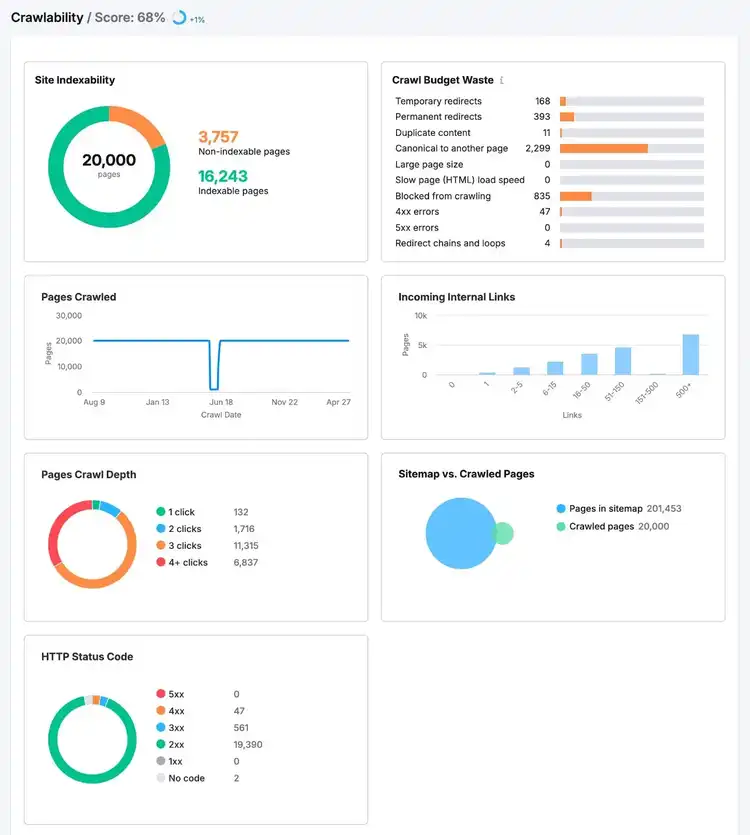
The “Crawlability” report in the Site Audit tool shows which parts of your site are easy (or difficult) for search engines to crawl.
The report gives you a clear view of how easily search engines can crawl and index your site. It highlights pages with issues and helps you quickly spot what needs fixing to improve visibility in search.
How to Improve It
Improve crawlability by avoiding common internal linking mistakes (like making sure you don’t have important pages buried several clicks deep), organizing your site with a clear structure, and submitting an XML sitemap.
Further reading: 15 Crawlability Problems & How to Fix Them
Track Website Metrics That Matter
Keeping an eye on your website is essential if you want to understand and improve your site’s performance.
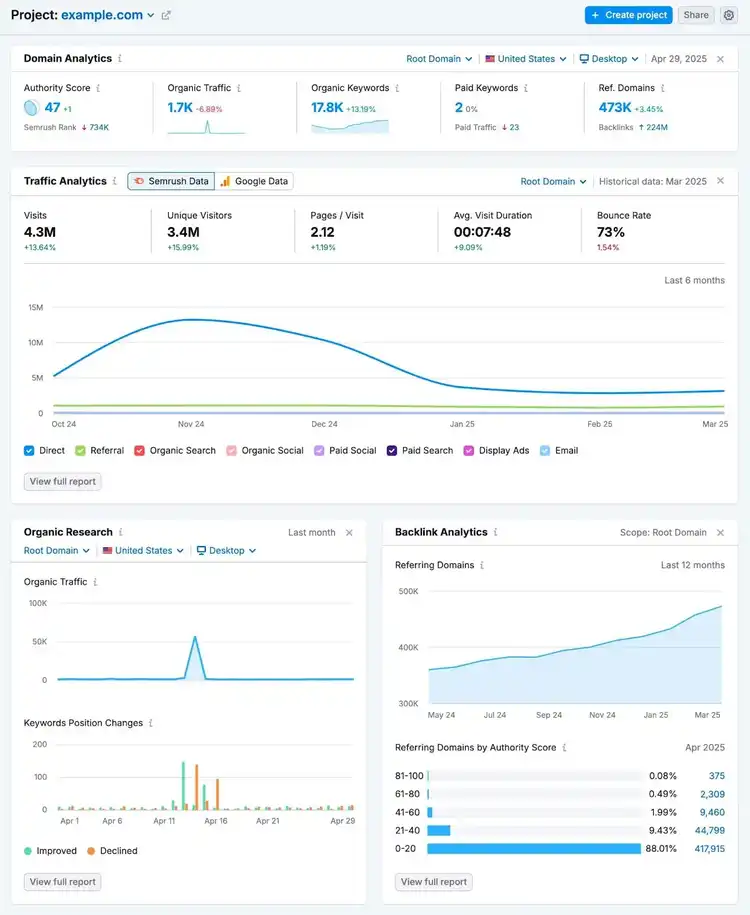
Semrush makes it easy. With a single account, you get access to numerous tools.
And you can easily create a Project Dashboard to monitor everything in one place.
Access 55+ Tools
with a Free Semrush Account

Cecilia is a senior editor and strategist with more than 12 years of experience shaping editorial strategies, refining brand messaging, and leading high-impact teams. She began her career in print and digital editorial leadership roles before transitioning to SEO and digital marketing, focusing on data-driven strategies. She‘s passionate about ensuring operational efficiency, upholding editorial standards, and mentoring writers to deliver top-quality, brand-aligned content.
Cecilia Meis
Cecilia is a senior editor and strategist with 12+ years of experience spanning print, digital, and SEO. She’s passionate about optimizing editorial processes, upholding quality standards, and mentoring writers to deliver brand-aligned content.
Tells Google to show you more from Semrush in AI, Search, and Discover.