
Pay-per-click (PPC) advertising is often an effective way to drive targeted traffic to your website.
But deciding which PPC campaign metrics to track can be a little confusing for beginners.
In this post, you’ll learn everything you need to know about which PPC metrics to track for your Google search ads and how you can gain insights from them to achieve better campaign results.
What Are PPC Metrics?
PPC metrics are specific data points that quantify your PPC advertising campaigns’ performance, which helps you identify both strengths and weaknesses.
By keeping a close eye on these metrics, you’re able to gain insights that allow you to make informed changes to your PPC strategy.
Now, let’s look at the most important PPC metrics to focus on.
1. Quality Score
Quality Score is a Google Ads metric that assesses the quality and relevance of your keywords, ads, and landing pages.
It’s expressed on a scale from 1 to 10—with 10 indicating the highest possible quality.
Google calculates your Quality Score based on a combination of three main factors:
- Expected CTR: How likely users are to click on your ad when it appears
- Ad relevance: How closely your ad’s content and keyword matches what searchers are looking for
- Landing page relevance: How useful, relevant, and easy to navigate your landing page is for users who click your ad
You can view your Quality Score for each keyword you’re targeting within Google Ads.
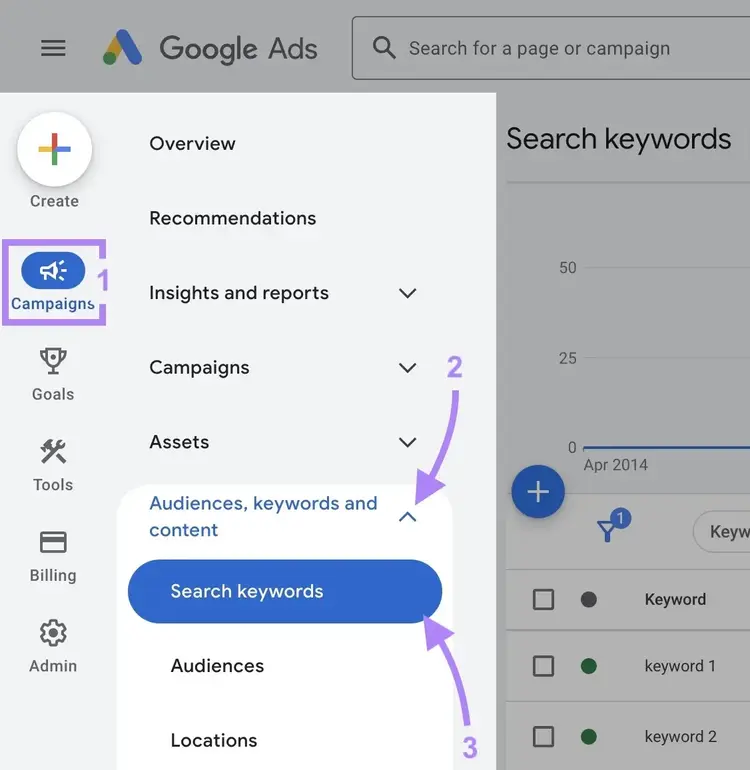
Click the “Audiences, keywords and content” drop-down in the left-hand menu. Then, click “Search keywords.”
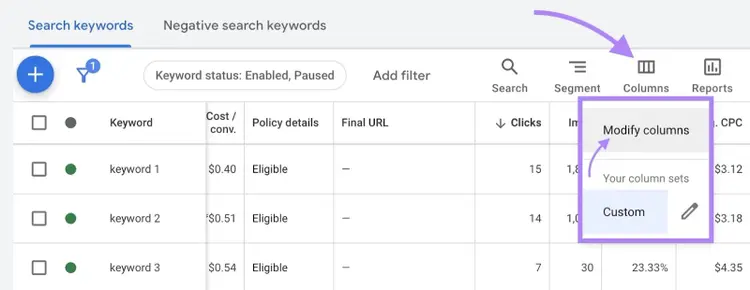
Next, click the “Columns” icon and select “Modify columns.”
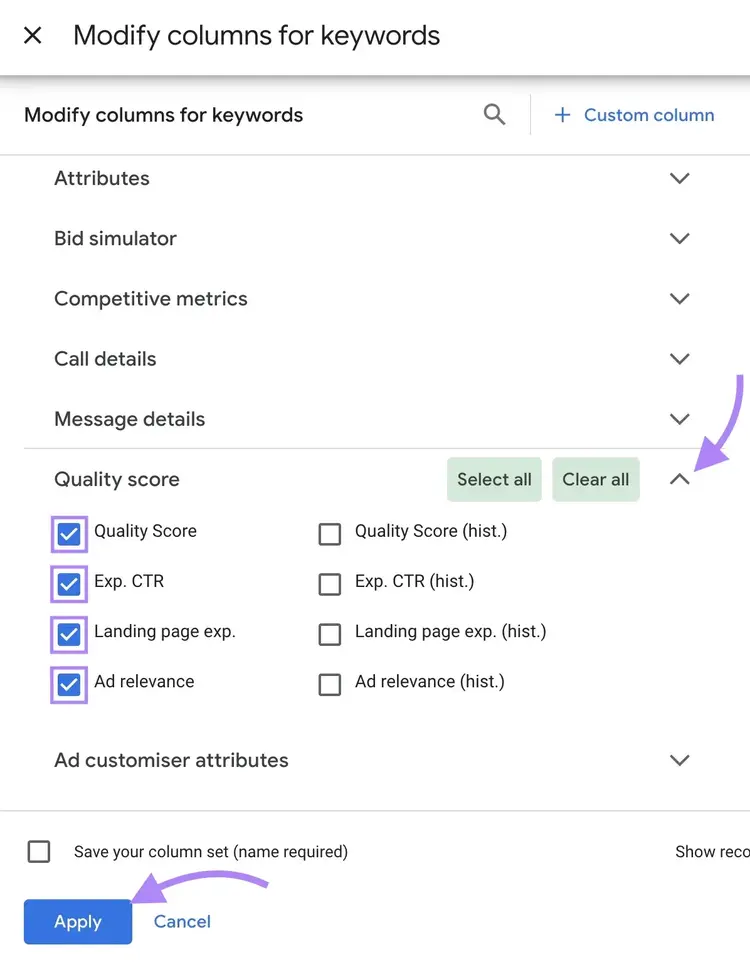
In the “Modify columns for keywords” window, click the arrow to expand the “Quality Score” section.
Then select the checkboxes next to “Quality Score,” “Landing page exp.,” “Exp. CTR,” and “Ad relevance.”
And click “Apply.”
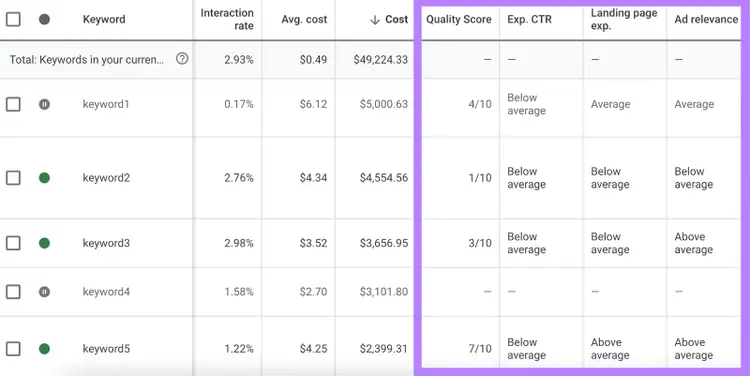
These columns will then appear in your keywords dashboard.
Like this:
Why Track Quality Score?
A high Quality Score is a good indication that your ads can receive prominent placements in Google’s search results and potentially cost less.
This is because a high score suggests that your ad is especially relevant. And Google’s goal is to show its users the most relevant ads possible.
On the other hand, a lower Quality Score may suggest you’ll face higher costs and poorer ad placements. So, tracking and improving your Quality Score could lead to improvements that boost your visibility and make your PPC campaigns more cost-effective.
How to Optimize Quality Score
Your Quality Score might not directly impact your ads’ performance, but it’s still a good idea to follow some tips for increasing it:
- Align keywords, ads, and landing pages: Ensure that your keywords are relevant to your ad copy and that your landing pages deliver on the ads' promises. Consistency across these elements will enhance the user experience.
- Improve ad relevance: Write compelling ads that directly address the search intent (what the searcher is hoping to achieve) behind the target keyword. Consider using dynamic keywords (a feature that automatically inserts the user’s search term into your ad text) to make your ads more relevant and click-worthy.
- Enhance the landing page experience: Provide high-quality, valuable content on your landing pages. And ensure that the pages load quickly, are mobile-friendly, and are easy to navigate.
2. Ad Position
Ad position measures where your ads appear when they’re shown in the search results.
Low numbers like 1 or 2 indicate top-of-page placements.
Google’s ad auction determines your ad’s position based on factors such as bid amount, ad quality, and the ad’s relevance to user’s search.
Ads with stronger overall performance in these areas tend to secure higher positions in the search results.
Google Ads provides two main metrics to help gauge how prominently your ads appear:
- Search top impression rate: How often your ads appear among the top ads (expressed as a percentage)
- Search absolute top impression rate: How often your ads appear as the very first ad among the top ads (expressed as a percentage)
But with Semrush’s Position Tracking tool, you can track your ads’ average positions more precisely.
Just follow the prompts to set up your project (make sure to select Google as your search engine).
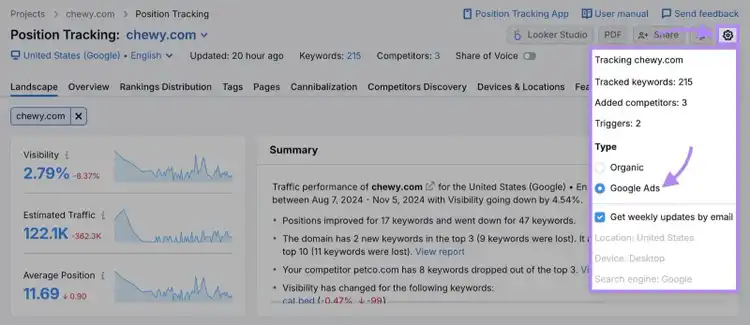
The “Landscape” report will show details about your domain’s overall keyword performance. To only view PPC data, click the gear icon in the top-right corner.
Then select the circle next to “Google Ads.”
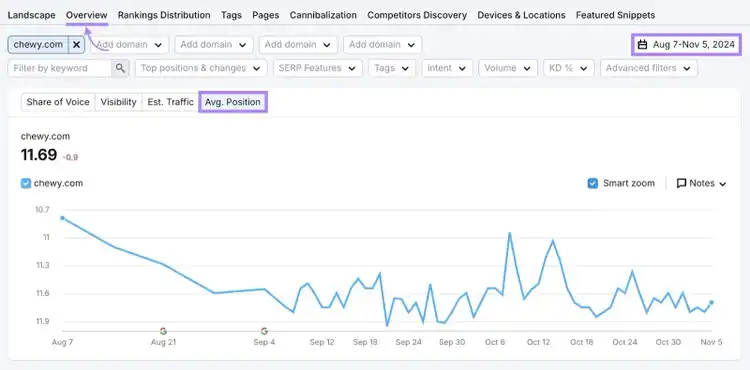
To see your average paid search ad position, open the “Overview” tab, set your timeframe, and select “Avg. Position.”
You can also scroll down to the “Rankings Overview” section to view your average position for the ads that appear for specific keywords.
Why Track Ad Positions?
Monitoring PPC ad positions is important because ads that appear in higher positions are generally more visible and likely to receive clicks.
So, if your ads aren’t appearing prominently in the search results, you may need to adjust your strategy to increase visibility and drive more clicks.
How to Optimize Ad Positions
Here are some ideas for improving your ad placements:
- Increase bid amounts: Higher bids can help secure better positions in competitive auctions
- Enhance ad relevance: Ensure your ad copy matches the intent behind the keywords you target
- Use ad assets: Increase engagement with ad assets (formerly called extensions) such as site links, call buttons, and location information
Further reading: PPC Optimization: 5 Steps to Better Ad Performance
3. Impressions
Impressions refer to the number of times your PPC ads are shown to users—regardless of whether the ads get clicks.
Higher impressions typically correlate with higher positions in search results.
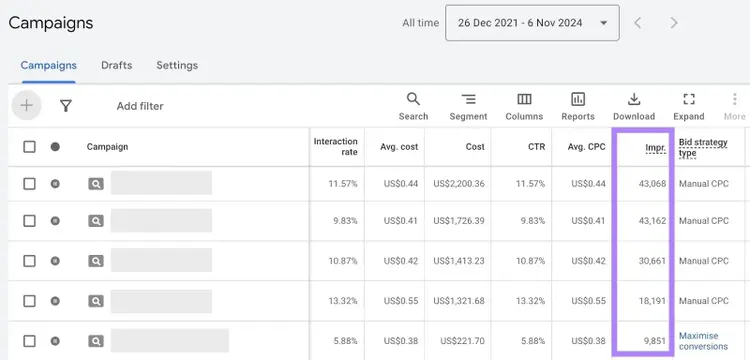
You can view your impressions in your campaign dashboard in Google Ads:
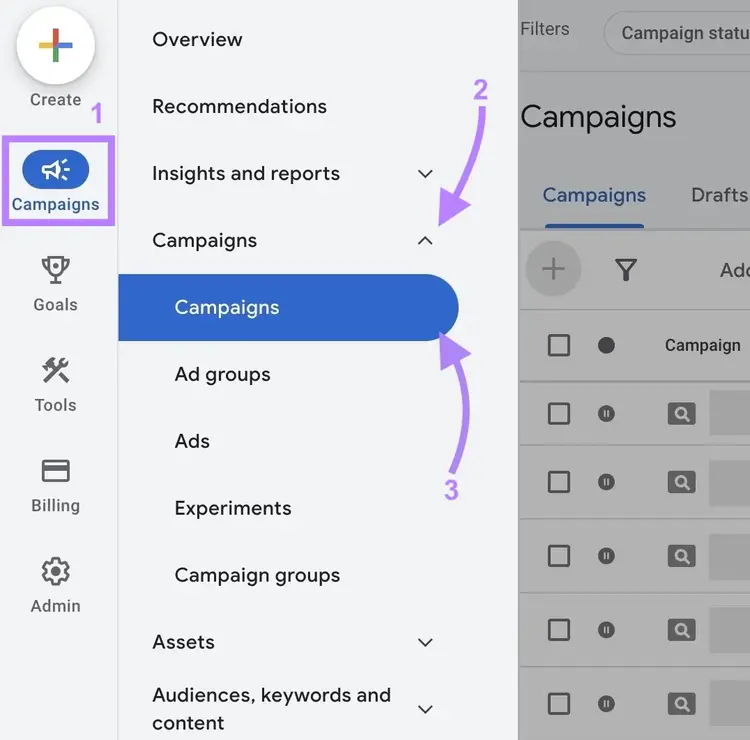
Once on that dashboard, just look for the “Impr.” column.
Why Track Impressions?
Impressions provide a top-level indication of your ad visibility within search results.
A high number of impressions suggests that your ads are being displayed frequently and prominently. Which increases the potential for users to take action.
How to Optimize Impressions
Here are some ways to boost your impression count:
- Expand your keyword list: Doing PPC keyword research to target more keywords that are relevant to your campaign will increase the chances of your ads appearing for more search queries
- Adjust your ad scheduling: Time your ads to run when your target audience is most active online. Check the “Ads schedule” report in Google Ads to see what times and days your ads perform best and adjust your schedule to prioritize high-performance periods.
- Increase your bids for certain terms: Consider increasing your bids for high-performing keywords. Higher bids can elevate your standing in ad auctions, resulting in more impressions.
4. Click-Through Rate
Click-through rate (CTR) is the ratio of clicks to impressions for your ads, which tells you what percentage of people who see your ads and end up clicking them.
Here’s the formula:
CTR = (total number of clicks / total number of impressions) x 100
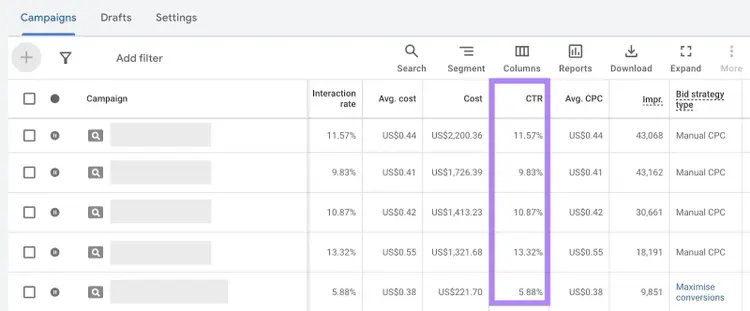
To view your CTR in Google Ads, go to your “Campaigns” report and look for the CTR column.
Like this:
Why Track CTR?
CTR indicates how relevant your ads are to your target audience.
A high CTR means that a significant number of people who see your ad are interested enough to click it. This suggests that your ad copy and keyword selection are effectively aligned with user intent.
How to Optimize CTR
Here are some ideas for boosting your campaigns’ CTRs:
- Refine your ad copy: Craft engaging and persuasive ad copy that resonates with your target audience. Use strong, action-oriented language and include clear calls to action (CTAs) that encourage users to click.
- Align keywords with ads: Ensure that your ads are highly relevant to the keywords you're targeting. This means incorporating target keywords into your ad headlines and descriptions, so users are likely to recognize them as relevant to their search queries.
- Incorporate ad assets: Add additional information to your ads—like phone number, sitelinks, or location details. These can lead to higher CTRs by giving users multiple ways to engage with your ad.
5. Cost Per Click
Cost per click (CPC) is the average amount you pay for each click on your ads.
It’s calculated by dividing the total cost of your clicks by the number of clicks your ads receive.
Here’s the formula:
CPC = total cost of clicks / total number of clicks
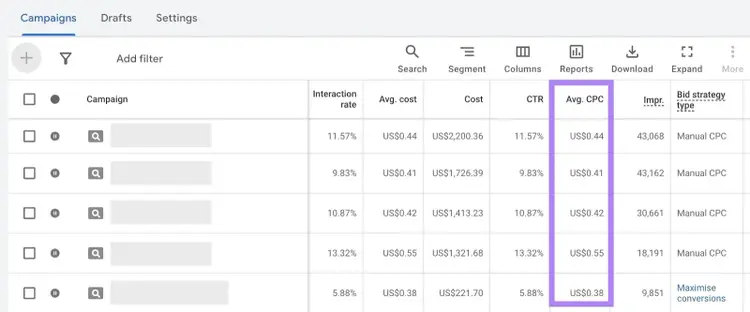
You can view your average CPC on the “Campaigns” dashboard within Google Ads.
You should see an “Avg. CPC” column in the table.
Like this:
Why Track CPC?
Tracking CPC is essential for managing your ad budget and assessing how cost-effective your campaigns are.
Knowing how much you’re spending to attract a new visitor (on average) allows you to adjust your bidding strategy to maximize your return.
How to Optimize CPC
Here are some tips for achieving a good CPC that’s as low as possible:
- Improve your ad quality: Google rewards ads that provide a good user experience with reduced costs, meaning a lower CPC
- Target long-tail keywords: Long-tail keywords are specific queries and are typically less expensive than broad keywords, so they often help you attract highly qualified traffic at a lower cost. For example, consider bidding on “womens running shoes” over “shoes.”
- Implement negative keywords: Use negative keywords to exclude search terms that aren’t relevant to your business. This prevents your ads from appearing for irrelevant searches, which reduces unnecessary clicks to lower your overall CPC.
6. Conversion Rate
Conversion rate is the percentage of users who take a desired action (making a purchase, filling out a form, etc.) after clicking one of your ads out of all the people who clicked on your ads.
Here’s the formula for calculating your conversion rate:
Conversion rate = (total number of conversions / total number of clicks) x 100
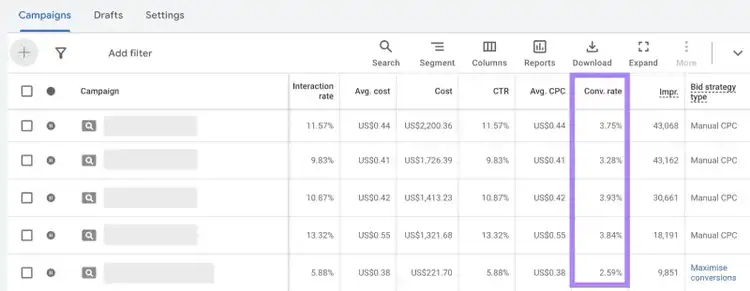
To view your conversion rates within the Google Ads “Campaigns” dashboard, start by clicking “Columns.”
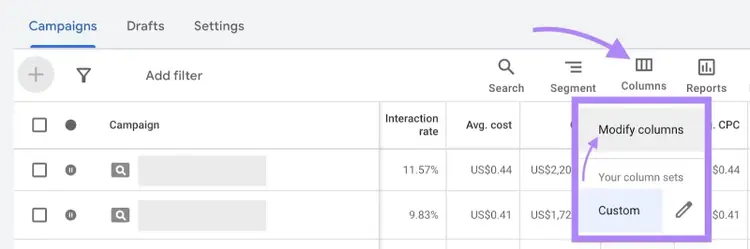
In the “Modify columns for campaigns” window, click the arrow to open the “Conversions” section.
Then select the box next to “Conv. rate” And click “Apply.”
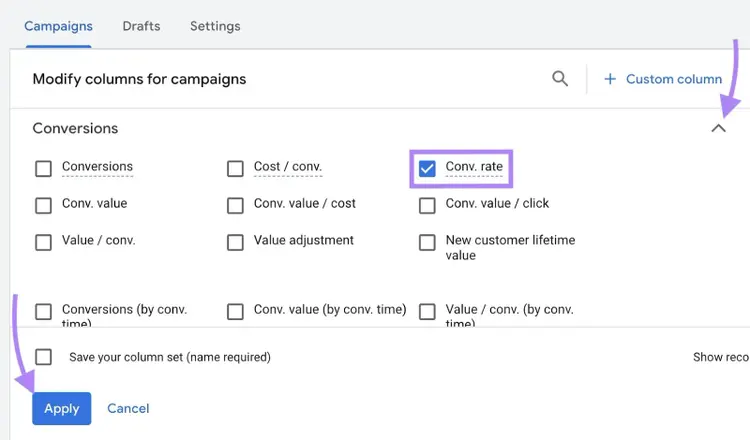
This will add a column for conversion rate to your dashboard.
Like this:
Why Track Conversion Rate?
Conversion rate is a direct measure of how well your campaign landing pages resonate with your audience and how effectively they turn visitors into customers or leads.
Low conversion rates suggest that your landing page or offer may not match visitors’ expectations.
How to Optimize Conversion Rate
Here are some ways to maximize your PPC conversion rates:
- Enhance your landing page’s relevance: Make sure your landing page content aligns with your ads’ messages and keywords. This ensures that visitors aren’t met with confusing or irrelevant information.
- Simplify the user experience: Minimize user friction by verifying that your page loads quickly and has a clean layout
- Use strong CTAs: Make your CTAs clear and compelling, so users know exactly what action to take
7. Cost Per Action
Cost per action (CPA) is the average cost of generating a new conversion through your PPC campaigns.
Here’s how it’s calculated:
CPA = total ad spend / total number of conversions
Why Track CPA?
Tracking CPA is crucial for understanding the efficiency of your PPC campaigns in driving conversions.
A lower CPA means you’re spending less for each conversion. Which improves your overall return.
Meanwhile, a high CPA could mean your campaign isn’t sufficiently optimized.
How to Optimize CPA
Here are some ideas for reducing your CPA:
- Refine your audience targeting: Narrow down your audience to those most likely to convert by adjusting demographic settings, interests, and behaviors. Consider running remarketing campaigns to target users who’ve previously interacted with your site but haven't converted yet.
- Optimize your bidding strategy: Consider using an automated bidding strategy like Target CPA bidding in Google Ads. This adjusts your bids in real time to help you get as many conversions as possible at your desired CPA.
- Improve ad and landing page quality: High-quality, relevant ads and landing pages are more likely to efficiently convert users
Further reading: How to Master CPA Marketing
8. Return on Ad Spend
Return on ad spend (ROAS) measures the revenue you generate for every dollar spent on PPC advertising to help you gauge your PPC campaigns’ profitability.
Here’s the formula for calculating return on ad spend as a percentage:
ROAS = (total ad revenue / total ad spend) x 100
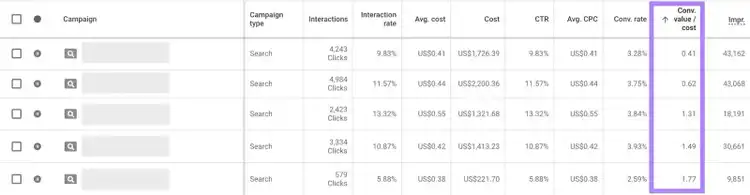
To view your ad spend return in your Google Ads “Campaigns” dashboard, modify the columns to show the “Conv. value / cost” metric (this is the ROAS metric in Google Ads).
Why Track ROAS?
ROAS is essential for evaluating how much revenue you’re generating for each dollar spent on PPC ads.
Tracking this metric helps you identify which campaigns are most profitable.
How to Optimize ROAS
Here are some tactics for increasing your ROAS:
- Prioritize the best-performing keywords: Allocate more budget to keywords that generate the most revenue. And consider pausing or reducing spend on underperforming keywords.
- Optimize ad scheduling: Analyze historical data to identify what times conversions are most likely to occur. Then, adjust your ad schedules accordingly.
- Enhance your landing pages: Make your landing pages as conversion-friendly as possible. This could mean simplifying the checkout process, offering multiple payment options, or improving product visuals and descriptions.
9. Bounce Rate
Bounce rate is the percentage of unengaged sessions on your PPC landing page.
A session counts as unengaged if the user meets at least one of these criteria:
- Didn’t convert
- Didn’t stay on the page for at least 10 seconds
- Didn’t view another page on your site
Here’s the formula for calculating bounce rate:
Bounce rate = (number of unengaged sessions / total number of sessions) x 100
To view your paid search bounce rate in Google Analytics (GA4), navigate to “Reports” > “Acquisition” > “Traffic acquisition.”
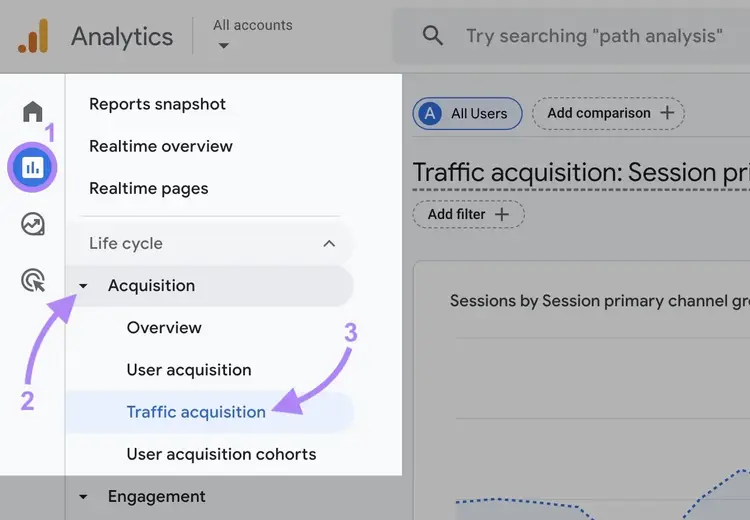
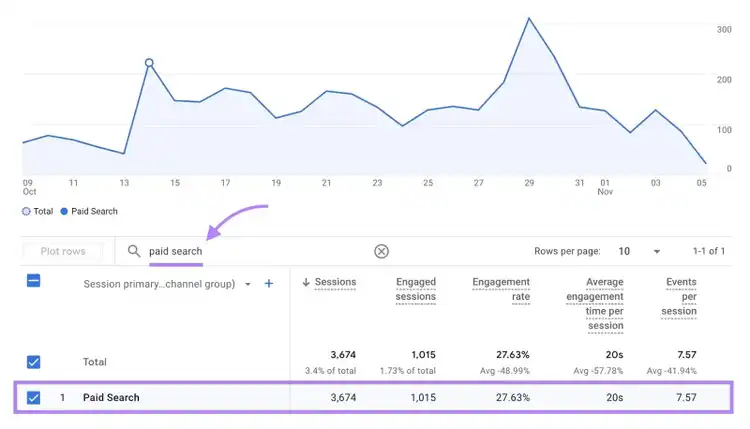
Then type “paid search” into the search bar above the table and tap the “Enter” or “return” key.
This will filter out all other traffic channels apart from paid search.
Next, click the “Customize report” pencil icon in the top-right corner.
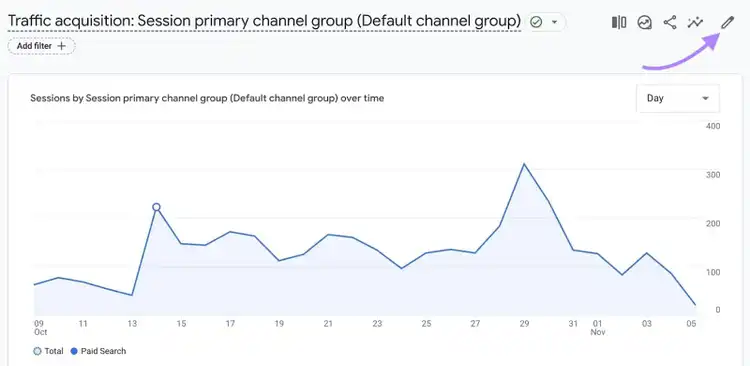
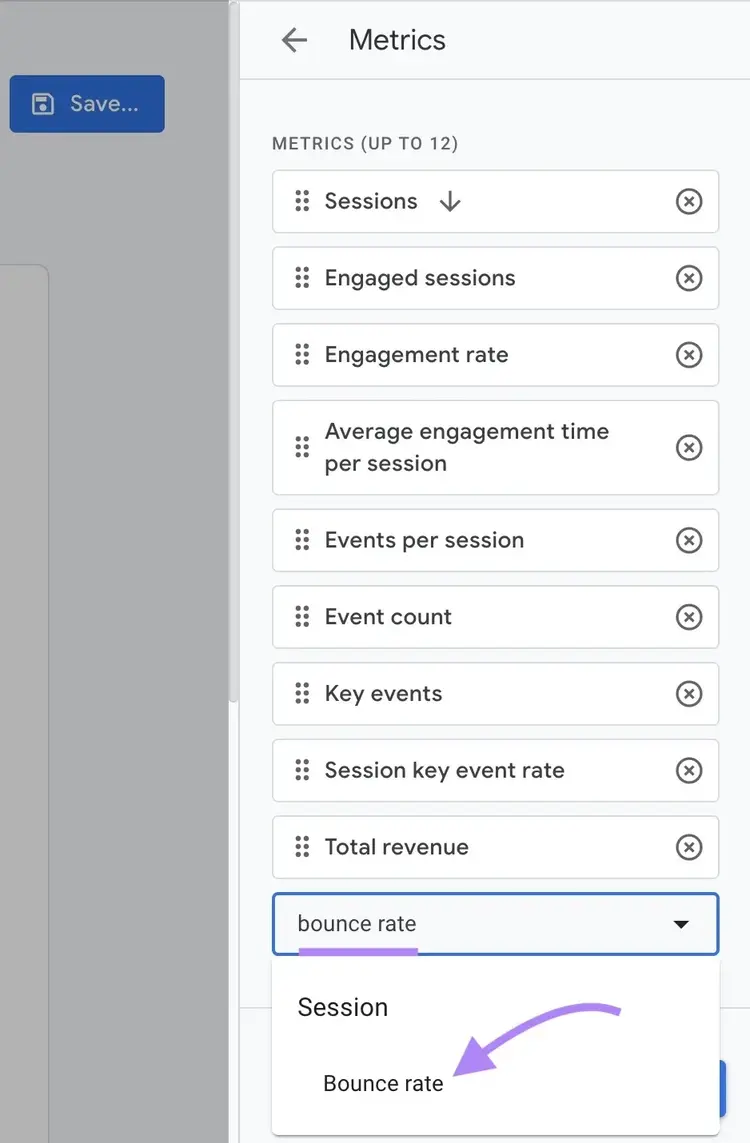
Then click “Metrics” > “Add metric.”
Start typing in “Bounce rate” and select it when you see it. Then, click “Apply” to save your changes.
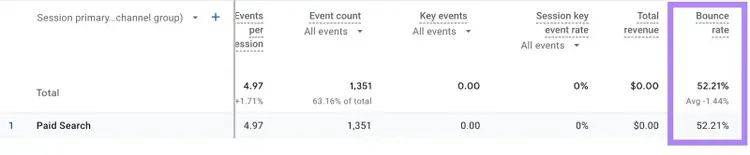
A bounce rate column will now appear in the traffic acquisition report.
Why Track Bounce Rate?
A high bounce rate can indicate that your landing page isn’t meeting user expectations, and you can use that information to look for ways to keep visitors engaged.
Maybe the page seems irrelevant to the ad they clicked. Or maybe there are other problems with the page’s user experience like a CTA that isn’t prominent.
How to Optimize Bounce Rate
Here are some ideas for lowering your landing page bounce rates:
- Make your landing pages as relevant as possible: Ensure your landing pages deliver on the promises you make in your ads and live up to users’ expectations
- Improve your page design and load speed: Create a visually appealing and user-friendly design. Optimize images and code to improve load times since slow-loading pages can lead to higher bounce rates.
- Tailor your landing pages for all device types: Ensure your landing pages are responsive and provide a seamless experience across desktop, tablet, and mobile devices
Track Your PPC Campaign Performance
Monitoring PPC metrics helps you understand the strengths of your campaigns and identify opportunities for improvement.
Of course, you’ll need the right tools to keep tabs on your performance metrics.
Google Ads and Google Analytics will help you analyze metrics like impressions, CTRs, and conversion rates. And Semrush's Position Tracking tool will help you track your search ads’ average positions in search results.
Track Your Rankings
with the Position Tracking Tool

Padrig is a copywriter for B2B SaaS and marketing companies, specializing in writing conversion copy and traffic-generating long-form articles. He has over ten years of digital marketing experience and holds a master‘s degree in decision science.
Tells Google to show you more from Semrush in AI, Search, and Discover.